class: title-slide, nobar  ## Workshop: Dealing with Data in R # Getting help in R ## After this workshop .footnote[Steffi LaZerte <https://steffilazerte.ca> | *Compiled: 2022-01-26*] --- class: section # First things first Save previous script Open New File <br>.medium[(make sure you're in the RStudio Project)] ![:spacer 10px]() Add `library(tidyverse)` to the top Save this new script .medium[consider names like `troubleshoting.R` or `5_getting_help.R`] --- class: nobar 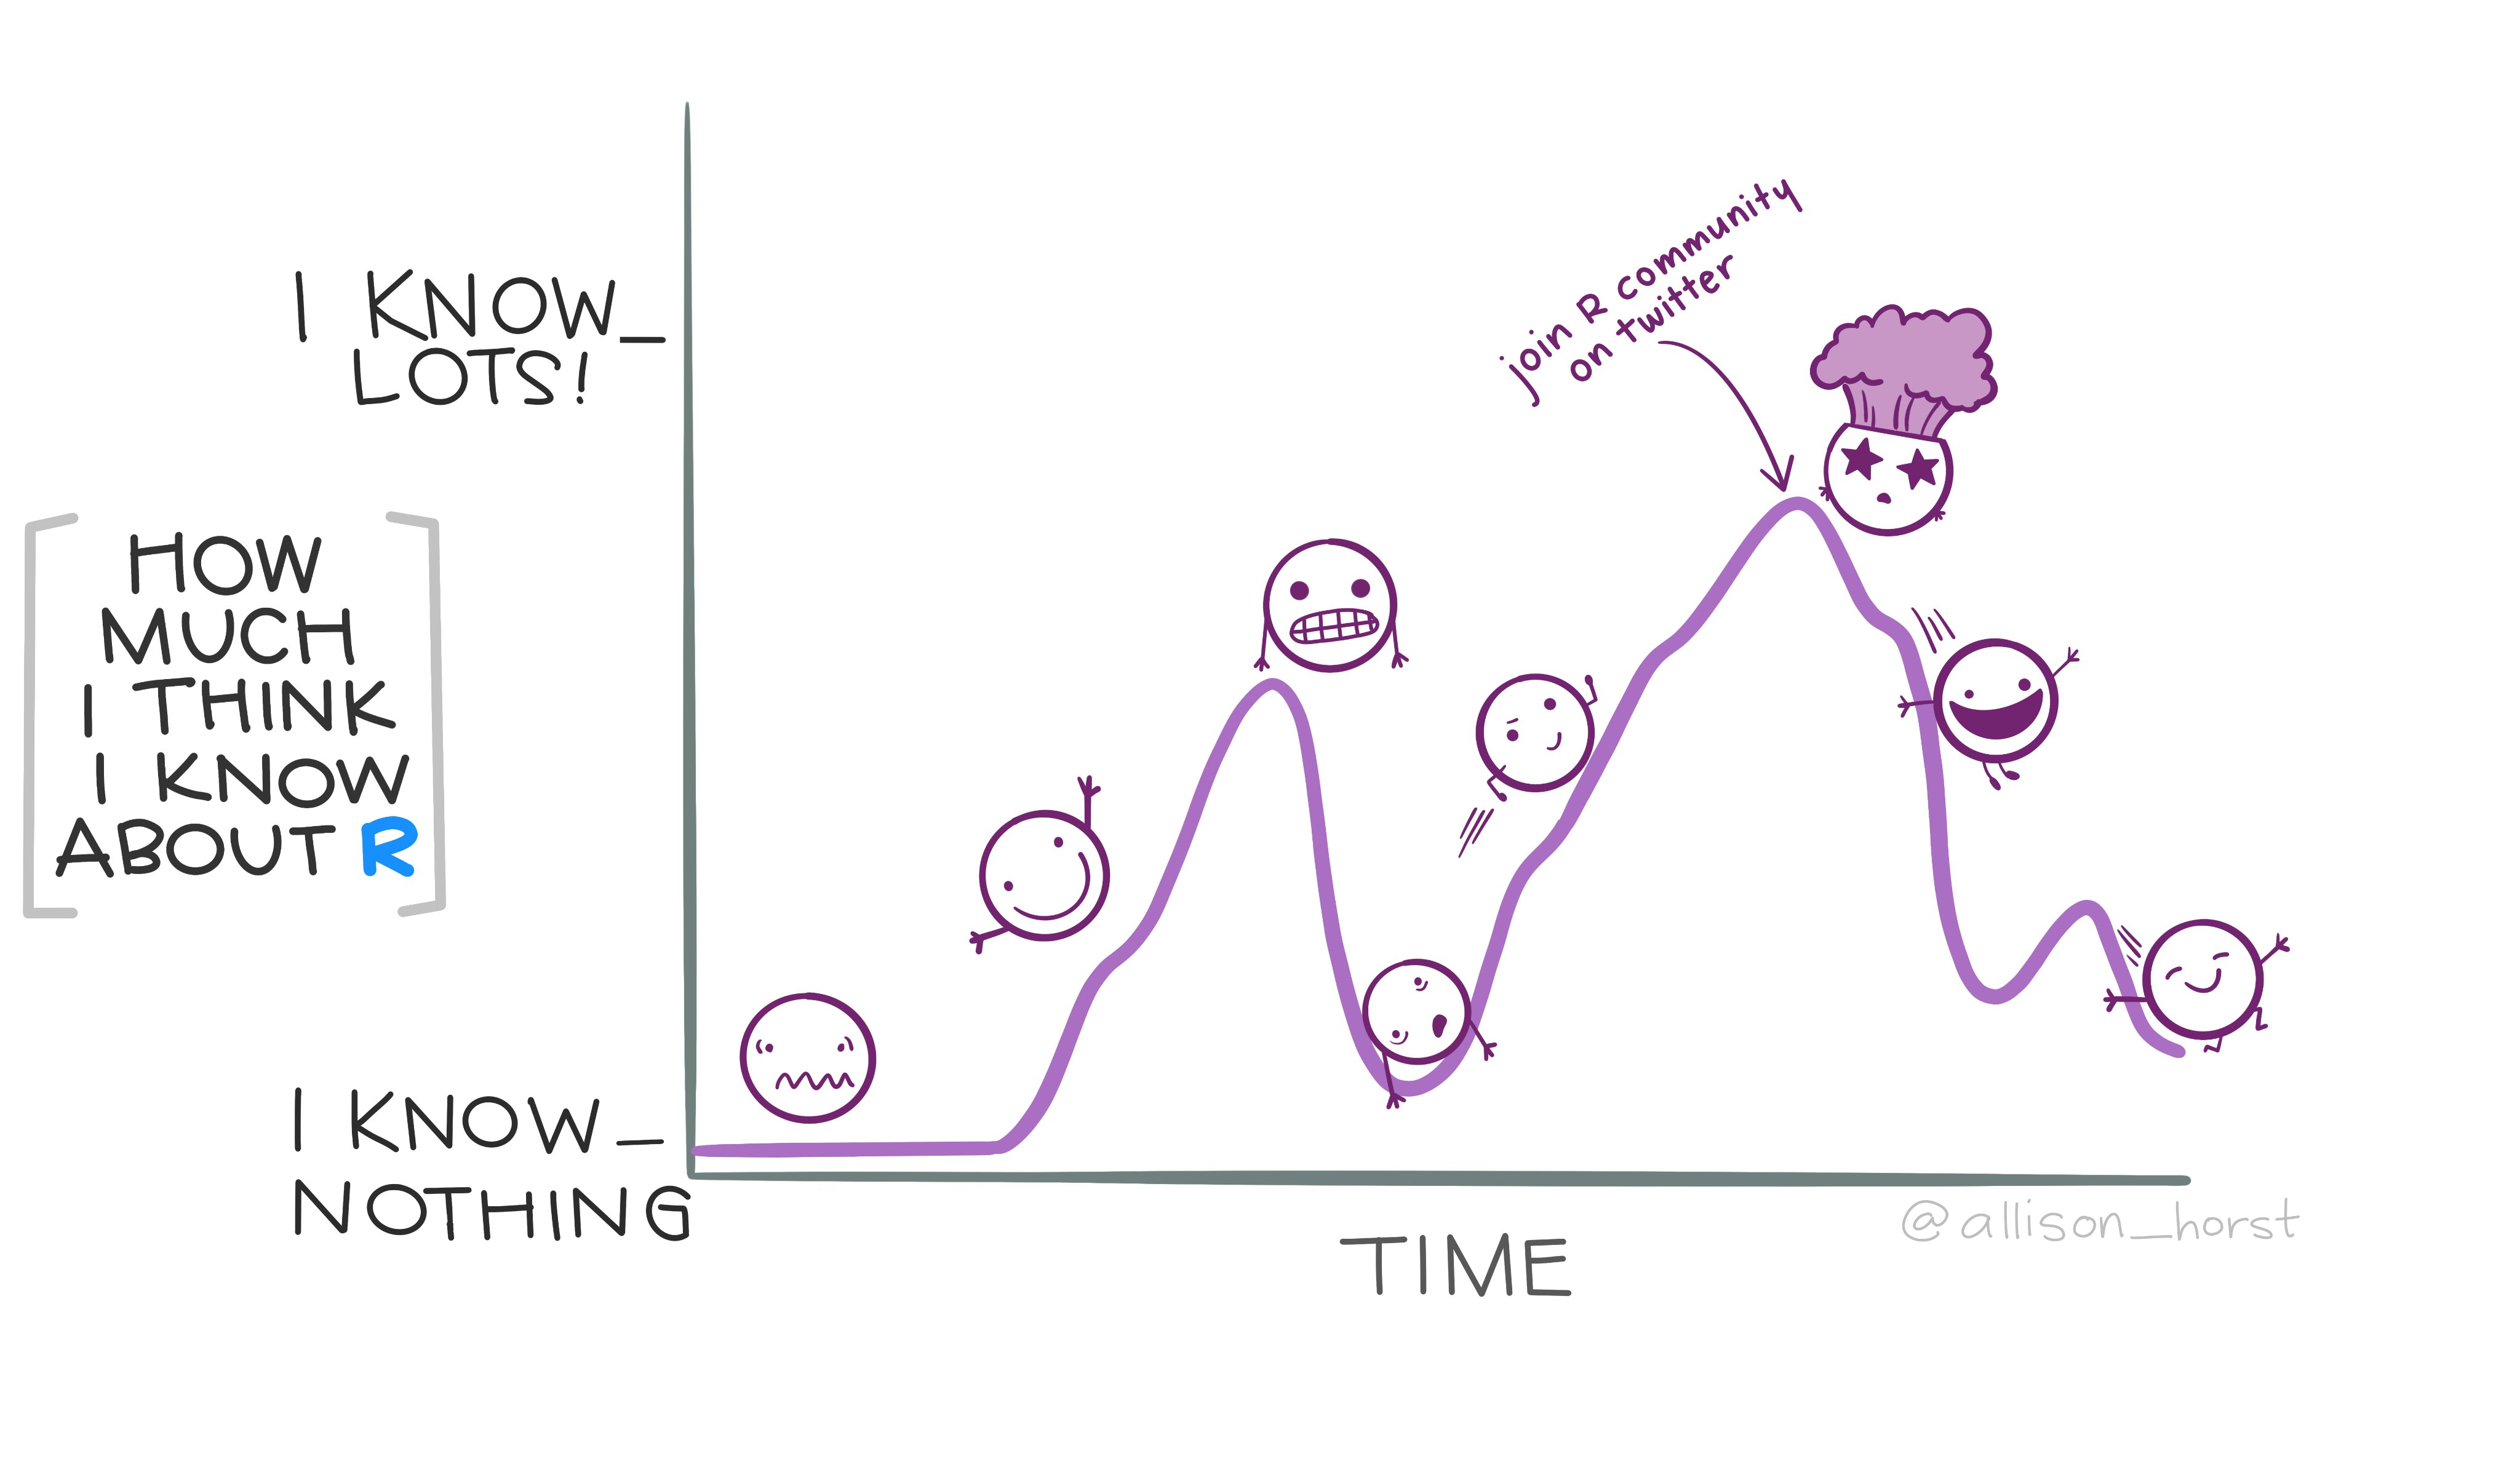 .footnote[Artwork by [@allison_horst on Twitter](https://twitter.com/allison_horst/status/1202229050284003328/photo/1) -- *"Knowing so little never felt so fun. #rstats"*] --- class: section # Troubleshooting --- # Bit by bit ### Line by line - R is sequential - If you skip lines, you're not running that part ```r #library(tidyverse) count(mtcars, am) ``` ``` ## Error in count(mtcars, am): could not find function "count" ``` -- - Error? Start at the beginning and go line by line ```r library(tidyverse) count(mtcars, am) ``` ``` ## am n ## 1 0 19 ## 2 1 13 ``` --- # Bit by bit ### Line by line ```r # Load Data size <- read_csv("./data/grain_size2.csv") # First modification size <- mutate(size, total_sand = coarse_sand + medium_sand + fine_sand, total_silt = coarse_silt + medium_silt + fine_silt) # Second modification size <- size %>% group_by(plot) %>% summarize(n = n(), total_sand = sum(total_sand), mean_sand = mean(total_sand), sd_sand = sd(total_sand), se_sand = sd_sand / sqrt(n)) ```   --- # Bit by bit ### Section by section ```r size <- read_csv("./data/grain_size2.csv") %>% mutate(total_sand = coarse_sand + medium_sand + fine_sand, total_silt = coarse_silt + medium_silt + fine_silt) %>% group_by(plot) %>% summarize(n = n(), total_sand = sum(total_sand), mean_sand = mean(totall_sand), sd_sand = sd(total_sand), se_sand = sd_sand / sqrt(n)) ``` ``` ## Error: Problem with `summarise()` column `mean_sand`. ## ℹ `mean_sand = mean(totall_sand)`. ## x object 'totall_sand' not found ## ℹ The error occurred in group 1: plot = "CSP01". ``` --- # Bit by bit ### Section by section ```r size <- read_csv("./data/grain_size2.csv") ``` No error -- ```r size <- read_csv("./data/grain_size2.csv") %>% mutate(total_sand = coarse_sand + medium_sand + fine_sand, total_silt = coarse_silt + medium_silt + fine_silt) ``` No error -- ```r size <- read_csv("./data/grain_size2.csv") %>% mutate(total_sand = coarse_sand + medium_sand + fine_sand, total_silt = coarse_silt + medium_silt + fine_silt) %>% group_by(plot) ``` No error --- # Bit by bit ### Section by section ```r size <- read_csv("./data/grain_size2.csv") %>% mutate(total_sand = coarse_sand + medium_sand + fine_sand, total_silt = coarse_silt + medium_silt + fine_silt) %>% group_by(plot) %>% summarize(n = n(), total_sand = sum(total_sand), mean_sand = mean(totall_sand), sd_sand = sd(total_sand), se_sand = sd_sand / sqrt(n)) ``` ``` ## Error: Problem with `summarise()` column `mean_sand`. ## ℹ `mean_sand = mean(totall_sand)`. ## x object 'totall_sand' not found ## ℹ The error occurred in group 1: plot = "CSP01". ``` Ah ha! --- # Bit by bit ## Applies to error messages too - First, don't panic! - Look at the error bit by bit ``` ## Error: Problem with `summarise()` column `mean_sand`. ## ℹ `mean_sand = mean(totall_sand)`. ## x object 'totall_sand' not found ## ℹ The error occurred in group 1: plot = "CSP01". ``` --- # Bit by bit ## Applies to error messages too ``` Error: Problem with 'summarise()' column 'mean_sand'` ``` Okay, we know the problem is in the `summarize()` part and then `mean_sand` part of that -- ![:spacer 10px]() ``` ℹ 'mean_sand = mean(totall_sand)' x object 'totall_sand' not found ``` Looks like this is the line with the problem. And the problem is `object 'totall_sand' not found`. **Ooops! Typo!** -- ![:spacer 10px]() ``` ℹ The error occurred in group 1: plot = "CSP01". ``` Lastly, it's telling us that the problem was when working with this group of data. (This can be useful when troubleshooting, because you can `filter()` your data and take a look) --- class: nobar 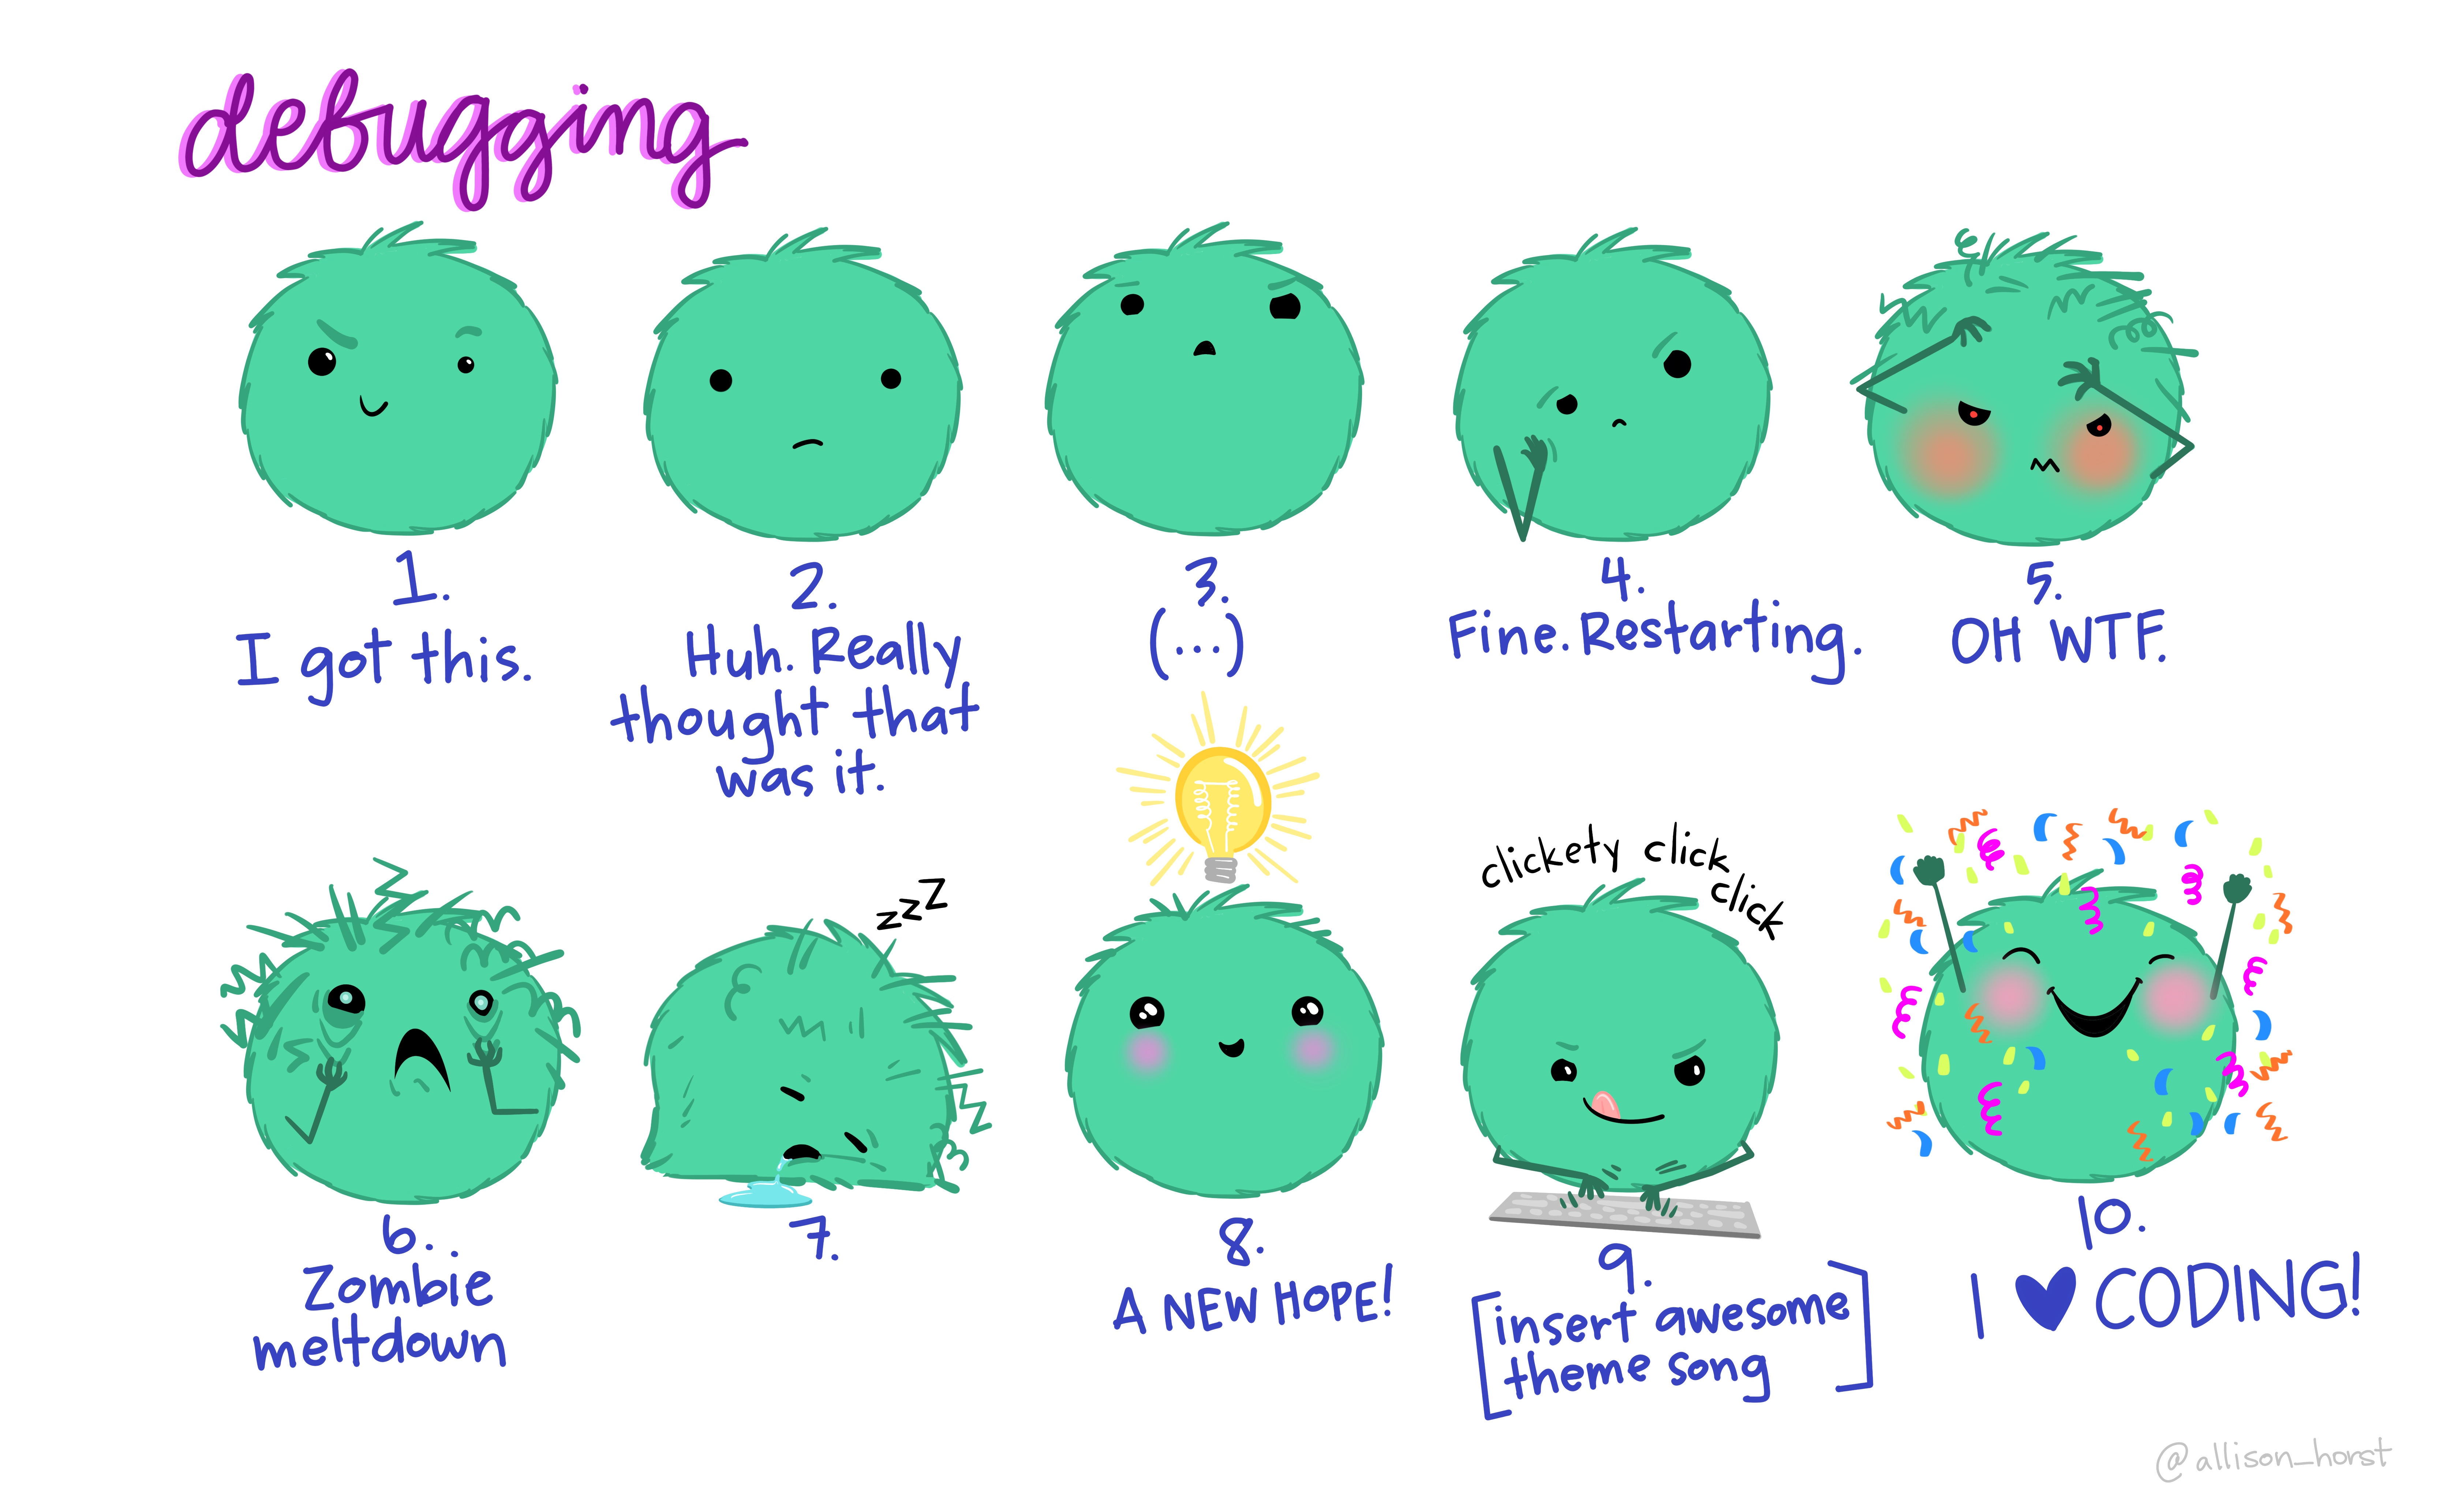 .footnote[Artwork by [@allison_horst](https://github.com/allisonhorst/stats-illustrations)] --- class: section # R is never wrong ![:spacer 32px]() --- class: section # R is never wrong ## Just sometimes unhelpful! --- class: section # Getting Help --- # Cheat Sheets ### RStudio Menu - Help - Cheatsheets ![:spacer 15px]() > Take a look yourself -- 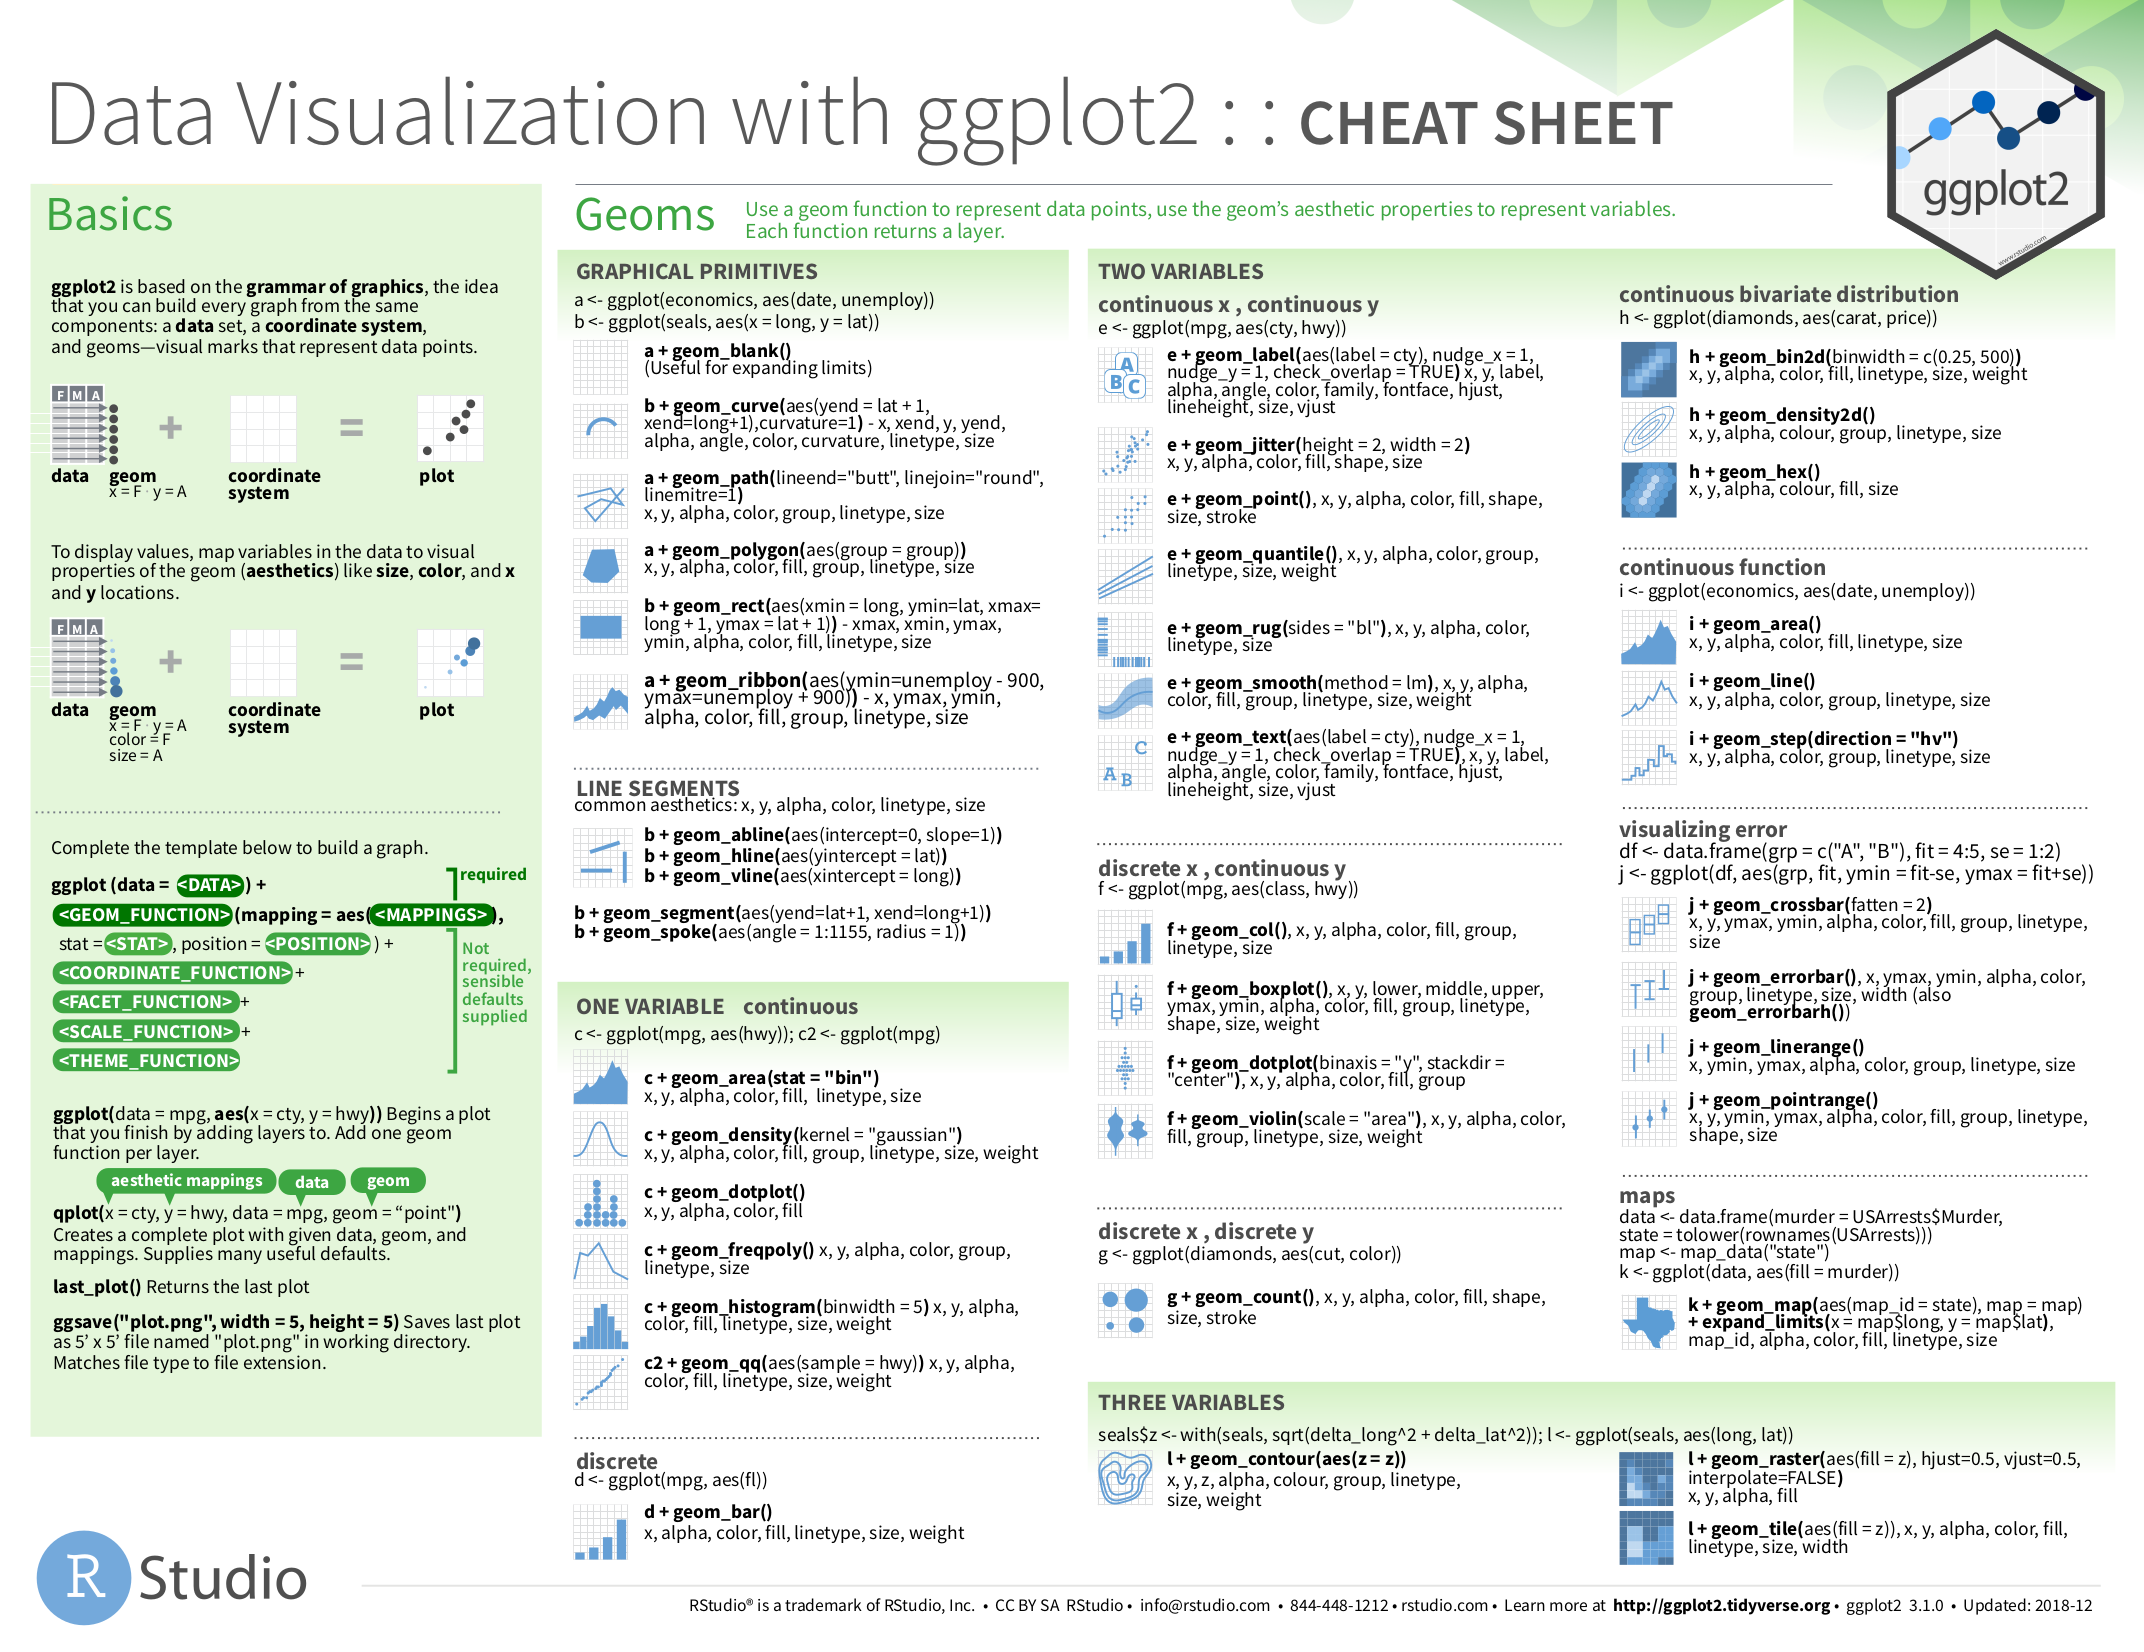 --- # Vignettes Many packages come with vignettes (aka, R tutorials) ### List Vignettes ```r vignette(package = "ggplot2") ``` ``` Vignettes in package ‘ggplot2’: ggplot2-specs Aesthetic specifications (source, html) extending-ggplot2 Extending ggplot2 (source, html) profiling Profiling Performance (source, html) ``` -- ### Load Vignettes ```r vignette("ggplot2-specs", package = "ggplot2") ``` > Try it! --- # Tutorials ### Vignettes also online - e.g., [`tidyverse`](https://tidyverse.org) ### Organizations/Websites - [Software Carpentry](https://software-carpentry.org/) - [STHDA](http://www.sthda.com/english/)  --- # Books! ### Free Online - [R for Data Science](http://r4ds.had.co.nz/data-visualisation.html) (read it!) - [R Graphics Cookbook](https://r-graphics.org/) (how to do X) - [`ggplot2`](https://ggplot2-book.org/) (next level) - [Data Visualization: A practical introduction](http://socviz.co/) - [Geocomputation with R](https://bookdown.org/robinlovelace/geocompr/) (spatial, GIS, maps) - [Statistical Inference via Data Science: A ModernDive into R and the tidyverse](https://moderndive.com) (stats) <!-- ### U of M Library - Online --> <!-- - [The R Book](https://search.lib.umanitoba.ca/permalink/01UMB_INST/o2jqjb/wilbookl10.1002%252F9781118448908) --> <!-- - [Generalized Linear Models With Examples in R](https://search.lib.umanitoba.ca/permalink/01UMB_INST/1ckhu3a/alma99149458994801651) --> <!-- - [Linear Mixed-Effects Models Using R A Step-by-Step Approach](https://search.lib.umanitoba.ca/permalink/01UMB_INST/1ckhu3a/alma99143075480001651) --> <!-- - [Mixed Effects Models and Extensions in Ecology with R](https://search.lib.umanitoba.ca/permalink/01UMB_INST/1ckhu3a/alma99149017057101651) --> --- class: section # Specific help --- # Examples ### In R ```r ?geom_boxplot ``` > Copy and paste the examples into your console --- class: split-50 # Examples .columnl[ ### On the web - Nice to see expected output - Helps figure out if it's your system or your code ]  --- class: space-list # Web searches - **Always include "R" in the search** - **Include the package name!** - **Use keywords** - **Some errors are very general** --- class: space-list # Web searches - **Always include "R" in the search** - **Include the package name!** - .hl[Try "R boxplots" vs. "R boxplots ggplot2"] - **Use keywords** - .hl[Try "R boxplots ggplot2 notch"] - **Some errors are very general** - .hl[Try "R Error: object 'm' not found"] --- class: section # Stackoverflow etc. ### ["R how to remove duplicate rows"](https://stackoverflow.com/questions/13967063/remove-duplicated-rows) --- class: space-list # Stackoverflow etc. ### Things to consider - Date (i.e., R version, Package Version) - Packages used (`tidyverse`? R base? A mix?) - What are the example data? - `mtcars` and `iris` are commonly used data sets built into R base - `msleep` and `diamonds` are commonly used data sets built into `ggplot2` - What are the example columns? - What is actually required to answer *your* question? --- # Asking for Help ### Not useful - "I got an error" - "It didn't work" -- ### Better! - "I got *this* error" - "It didn't give me *this*" -- ### Best!! - "I did *this* and I got *this* error" - "I expected it to do *this*, but in fact the output was *this*" -- ### Best of the Best!!! - "I did *this* [small reproducible code, including data set] and I got *this* [exact error/output]" --- class: space-list # Reproducible Examples .columnl[ - Minimal code and data required to reproduce the error - Often preparing this actually helps you solve the error! - Includes - packages (`library()`) - data - runnable code ] --- # Reproducible Examples ## How do I change the order of `vore`? .columnl[ ### Not reproducible ```r ggplot(data = m, aes(x = vore, y = awake, fill = `Body Size`)) + theme_bw() + theme(axis.title.x = element_blank()) + geom_boxplot() + scale_fill_viridis_d() + labs(y = "Awake time (hrs)", title = "Awake time by Diet") ``` ``` ## Error in ggplot(data = m, aes(x = vore, y = awake, fill = `Body Size`)): could not find function "ggplot" ``` - No indication of packages - No indication of what `m` is ] --- class: split-60 # Reproducible Examples ## How do I change the order of `vore`? .columnl[ ### Reproducible, but not minimal ```r *library(ggplot2) *m <- msleep %>% * mutate(`Body Size` = if_else(bodywt > median(bodywt), * "Large", "Small")) ggplot(m, aes(x = vore, y = awake, fill = `Body Size`)) + theme_bw() + theme(axis.title.x = element_blank()) + geom_boxplot() + scale_fill_viridis_d() + labs(y = "Awake time (hrs)", title = "Awake time by Diet") ``` ] .columnr[  ] --- class: split-60 # Reproducible Examples ## How do I change the order of `vore`? .columnl[ ### Reproducible AND Minimal ```r library(ggplot2) ggplot(msleep, aes(x = vore, y = awake)) + geom_boxplot() ``` ] .columnr[  ] --- class: section # Paying it forward --- # Citing Software ### In-line Text - Software name - Version - Programmers/authors OR Journal article releasing the software (if available) ### Bibliography - Journal article releasing the program **OR** - Programmers/authors - Year of release - Program Name - URL --- # Citing R ### Inline "All statistical analyses were performed with R statistical software (v3.6.2, R Core Team 2019)." ### Bibliography .hanging[ R Core Team (2019). R: A language and environment for statistical computing. R Foundation for Statistical Computing, Vienna, Austria. URL https://www.R-project.org/.] --- # Citing R ### Version information ```r R.Version()$version.string ``` ``` ## [1] "R version 4.1.2 (2021-11-01)" ``` ### Citation information ```r citation() ``` ``` ## ## To cite R in publications use: ## ## R Core Team (2021). R: A language and environment for statistical ## computing. R Foundation for Statistical Computing, Vienna, Austria. ## URL https://www.R-project.org/. ``` --- # Citing R Packages ### Inline "All statistical analyses were performed with R statistical software (v4.0.3, R Core Team 2020). We performed Type III ANOVAs using the 'car' package for R (v3.0.10, Fox and Weisberg)." ### Bibliography .hanging[ John Fox and Sanford Weisberg (2019). An R Companion to Applied Regression, Third Edition. Thousand Oaks CA: Sage.] --- # Citing R Packages ### Version information ```r packageVersion("car") ``` ``` ## [1] '3.0.12' ``` ### Citation information ```r citation("car") ``` ``` ## ## To cite the car package in publications use: ## ## John Fox and Sanford Weisberg (2019). An {R} Companion to Applied ## Regression, Third Edition. Thousand Oaks CA: Sage. URL: ## https://socialsciences.mcmaster.ca/jfox/Books/Companion/ ``` ![:spacer 10px]() See more about citing packages in my rOpenSci blog post: [How to Cite R and R packages](https://ropensci.org/blog/2021/11/16/how-to-cite-r-and-r-packages/) --- class: nobar  .footnote[Artwork by [@allison_horst](https://github.com/allisonhorst/stats-illustrations)] ![:spacer 100px]() ### You made it! ### Thank you!