class: title-slide, nologo, nobar ### Symposium ![:spacer 30px]() # R pour ornithologue ### .rblue[Points de vue des utilisateuRs et programmeuRs] ![:spacer 30px]() # R for Ornithologists ### .rblue[Perspectives from useRs to programmeRs (to birdeRs)] ![:spacer 10px]() **10:30-14:15** Salle des Plaines II  .footer[SCO-SOC 2019] ??? Ornithologists “in the era of new technologies” have access to ever increasing sources of data, which in turn leads to large quantities of data. This wealth of data is exciting, but sometimes overwhelming, and with new technologies for collecting data, we need new technologies for processing and analyzing data. One such technology is the free and open source programming language, R. R is a powerful (and economical) tool that is highly extensible through ‘packages’ for performing specific tasks. Because there are so many packages, many ornithologists are not aware of the many ways in which R can be useful, or which packages are available for purposes beyond statistical analysis. However, there are numerous packages which have been developed for specific scientific, or even ornithological applications. Such examples include those for accessing relevant online data sources (e.g., climate data, eBird, population data, etc.), genomic analyses, bioacoustic analyses, analyses of animal movements, reproducible research workflow, and dissemination (e.g., graphs, maps, and interactive visualizations). This presentation will introduce ornithologists to these tools which make ornithological research quicker, easier, more affordable, and stronger. --- class: title-slide, nologo, nobar ![:spacer 10px]() .hanging[ ### Stefanie E. LaZerte]   ![:spacer 50px]() # R for Ornithologists ### How R can benefit the study of Ornithology ![:spacer 30px]() ![:info h, , bottom: 10px]()  --- # What is R? -- ## A statistical programming language and environment (free and open source!) -- ## R uses packages - Packages extend R (i.e. `nlme` and `lme4` add mixed modeling) - Packages can be written by anyone - Some are ok, some are good, some are AMAZING - .rblue[Base R] is R without any extra packages (also good) > There are 1000's of packages! --- background-image: url(./Figures/R_hard.png) background-position: right 15% bottom 10% background-size: 70% # R is hard --- background-image: url(./Figures/impostR_en.png) background-position: center center background-size: 70% # Impost**R** Syndrome --- background-image: url(./Figures/impostR_en.png) background-position: right 75px top 23% background-size: 30% # Impost**R** Syndrome  --  --- background-image: url(./Figures/impostR.png) background-position: right 75px top 23% background-size: 30% # Impost**R** Syndrome ![:spacer 210px]()  **Using R in the undergraduate biology classroom**: Hurdles, hints, and aha moments (.rblue[Here @ 1:45pm]) --- background-image: url(./Figures/owl_computer.jpg) background-position: right 75px bottom 125px background-size: 45% # Ornithologists and R ## What I **am not** going to do - Teach you R - Talk about statistics -- ## What I **am** going to do - Explain how R can benefit ornithologists - Showcase useful packages - Give you resources to get started -- - Inspire you to take your .rblue[R] to the next level! ??? - What??!?!! Can you have a presentation about R without these two things? - The goal of this presentation is not to explain how to use R, but rather --- background-image: url(./Figures/R_powerful2_edit.png) background-position: center bottom 40% background-size: 70% # Why ornithologists should use R ## R is powerful! --- # Why ornithologists should use R ## R is powerful! ![:spacer 15px]() **The blessing and curse of automated data collection:** R and dealing with big data in a modern age (.rblue[Here @ 10:45am]) ![:spacer 40px]() **Super-computing with R:** Harnessing the power of the cloud to analyze big-bird-data, or just run your simulations, models, and cross-validations faster (.rblue[Here @ 11:15am]) --- # Why ornithologists should use R ## Reproducible Science - Scripts are records of your work ```r m <- lm(mpg ~ cyl, data = mtcars) summary(m) ``` -- - Scripts can be compiled into pdf/html reports with [**`rmarkdown`**](https://rmarkdown.rstudio.com/) and [**`knitr`**](https://yihui.name/knitr/) (In RStudio: `File > Compile Report`)   --- # Why ornithologists should use R ## Reproducible Science - Keep track of code AND output  -- - Keep track of data  -- - Keep track of software  --- # Why ornithologists should use R ## Find Data! - Many online data sources are accessible through R - Reproducible science includes data sources! -- ### Packages - Observations from [ebird](https://ebird.org) with [**`auk`**](https://github.com/CornellLabofOrnithology/auk)  -- - Observations from [NatureCounts](https://naturecounts.ca) with [**`naturecounts`**](https://github.com/birdstudiescanada/naturecounts) (.rblue[Here @ 11:00am]) -- - Recordings of vocalizations from [xeno-canto](https://www.xeno-canto.org/) with [**`warbleR`**](https://github.com/maRce10/warbleR)  -- - Weather data from [Environment and Climate Change Canada](http://climate.weather.gc.ca/) with [**`weathercan`**](https://github.com/ropensci/weathercan)  -- - DNA Sequences from [GenBank](https://www.ncbi.nlm.nih.gov/genbank/) with [**`phylotaR`**](https://github.com/ropensci/phylotaR)  -- - Taxonomic data with [**`taxize`**](https://github.com/ropensci/taxize) -- - IUCN Red Lists with [**`rredlist`**](https://github.com/ropensci/rredlist) ??? - brranching: Includes methods for fetching 'phylogenies' from a variety of sources, including the 'Phylomatic' web service (<http://phylodiversity.net/phylomatic>), and 'Phylocom' (<https://github.com/phylocom/phylocom/>). - Data published on [dryad](https://datadryad.org/) with [**`rdryad`**](https://github.com/ropensci/rdryad) --- # Why ornithologists should use R ## Dealing with Data  --  --- class: split-50 # Why ornithologists should use R .columnl[ ## Dealing with Data - Reproducible! - Cleaning - Fix typos - Fix/explore odd/missing values - Filtering - Summarizing - Transforming - Exploring ] -- .columnr[ ## Packages to Use - Base R (i.e. no special packages) - [`data.table`](http://r-datatable.com) (<http://r-datatable.com>) - [`tidyverse`](http://tidyverse.org) (<http://tidyverse.org>) - Suite of packages - Learn more: [R for Data Science](https://r4ds.had.co.nz/) ]   ??? I don't know about you, but I've never come back from the field and thought, great, my data is perfectly ready for analysis. --- # Why ornithologists should use R ## 100's of Specialized packages ### For example... -- - Phylogenetic comparative analyses [**`adephylo`**](https://github.com/thibautjombart/adephylo) -- - Bioacoustic analyses with [**`seewave`**](http://rug.mnhn.fr/seewave/)  -- - Automatic detection of vocalizations with [**`monitoR`**](http://www.uvm.edu/rsenr/vtcfwru/R/?Page=monitoR/monitoR.htm) -- - Animal home ranges with [**`adehabitatHR`**](https://cran.r-project.org/web/packages/adehabitatHR/) -- - Hierarchical Bayesian modelling of Breeding Bird Survey data with [**`bbsBayes`**](https://github.com/BrandonEdwards/bbsBayes) (.rblue[Here @ 11:30am])  -- - Systematic reviews with [**`litsearchr`**](https://elizagrames.github.io/litsearchr/) (.rblue[Here @ 1:30pm])  ??? - Animal movements detected by RFID with [**`feedr`**](https://github.com/animalnexus/feedr) --- # Why ornithologists should use R ## Dissemination and Visualizations - Beautiful plots with [**`ggplot2`**](https://ggplot2.tidyverse.org/)   -- - Complex maps with [**`sf`**](https://r-spatial.github.io/sf/), [**`tmap`**](https://github.com/mtennekes/tmap)   -- - Interactive visualizations with [**`shiny`**](https://shiny.rstudio.com/) 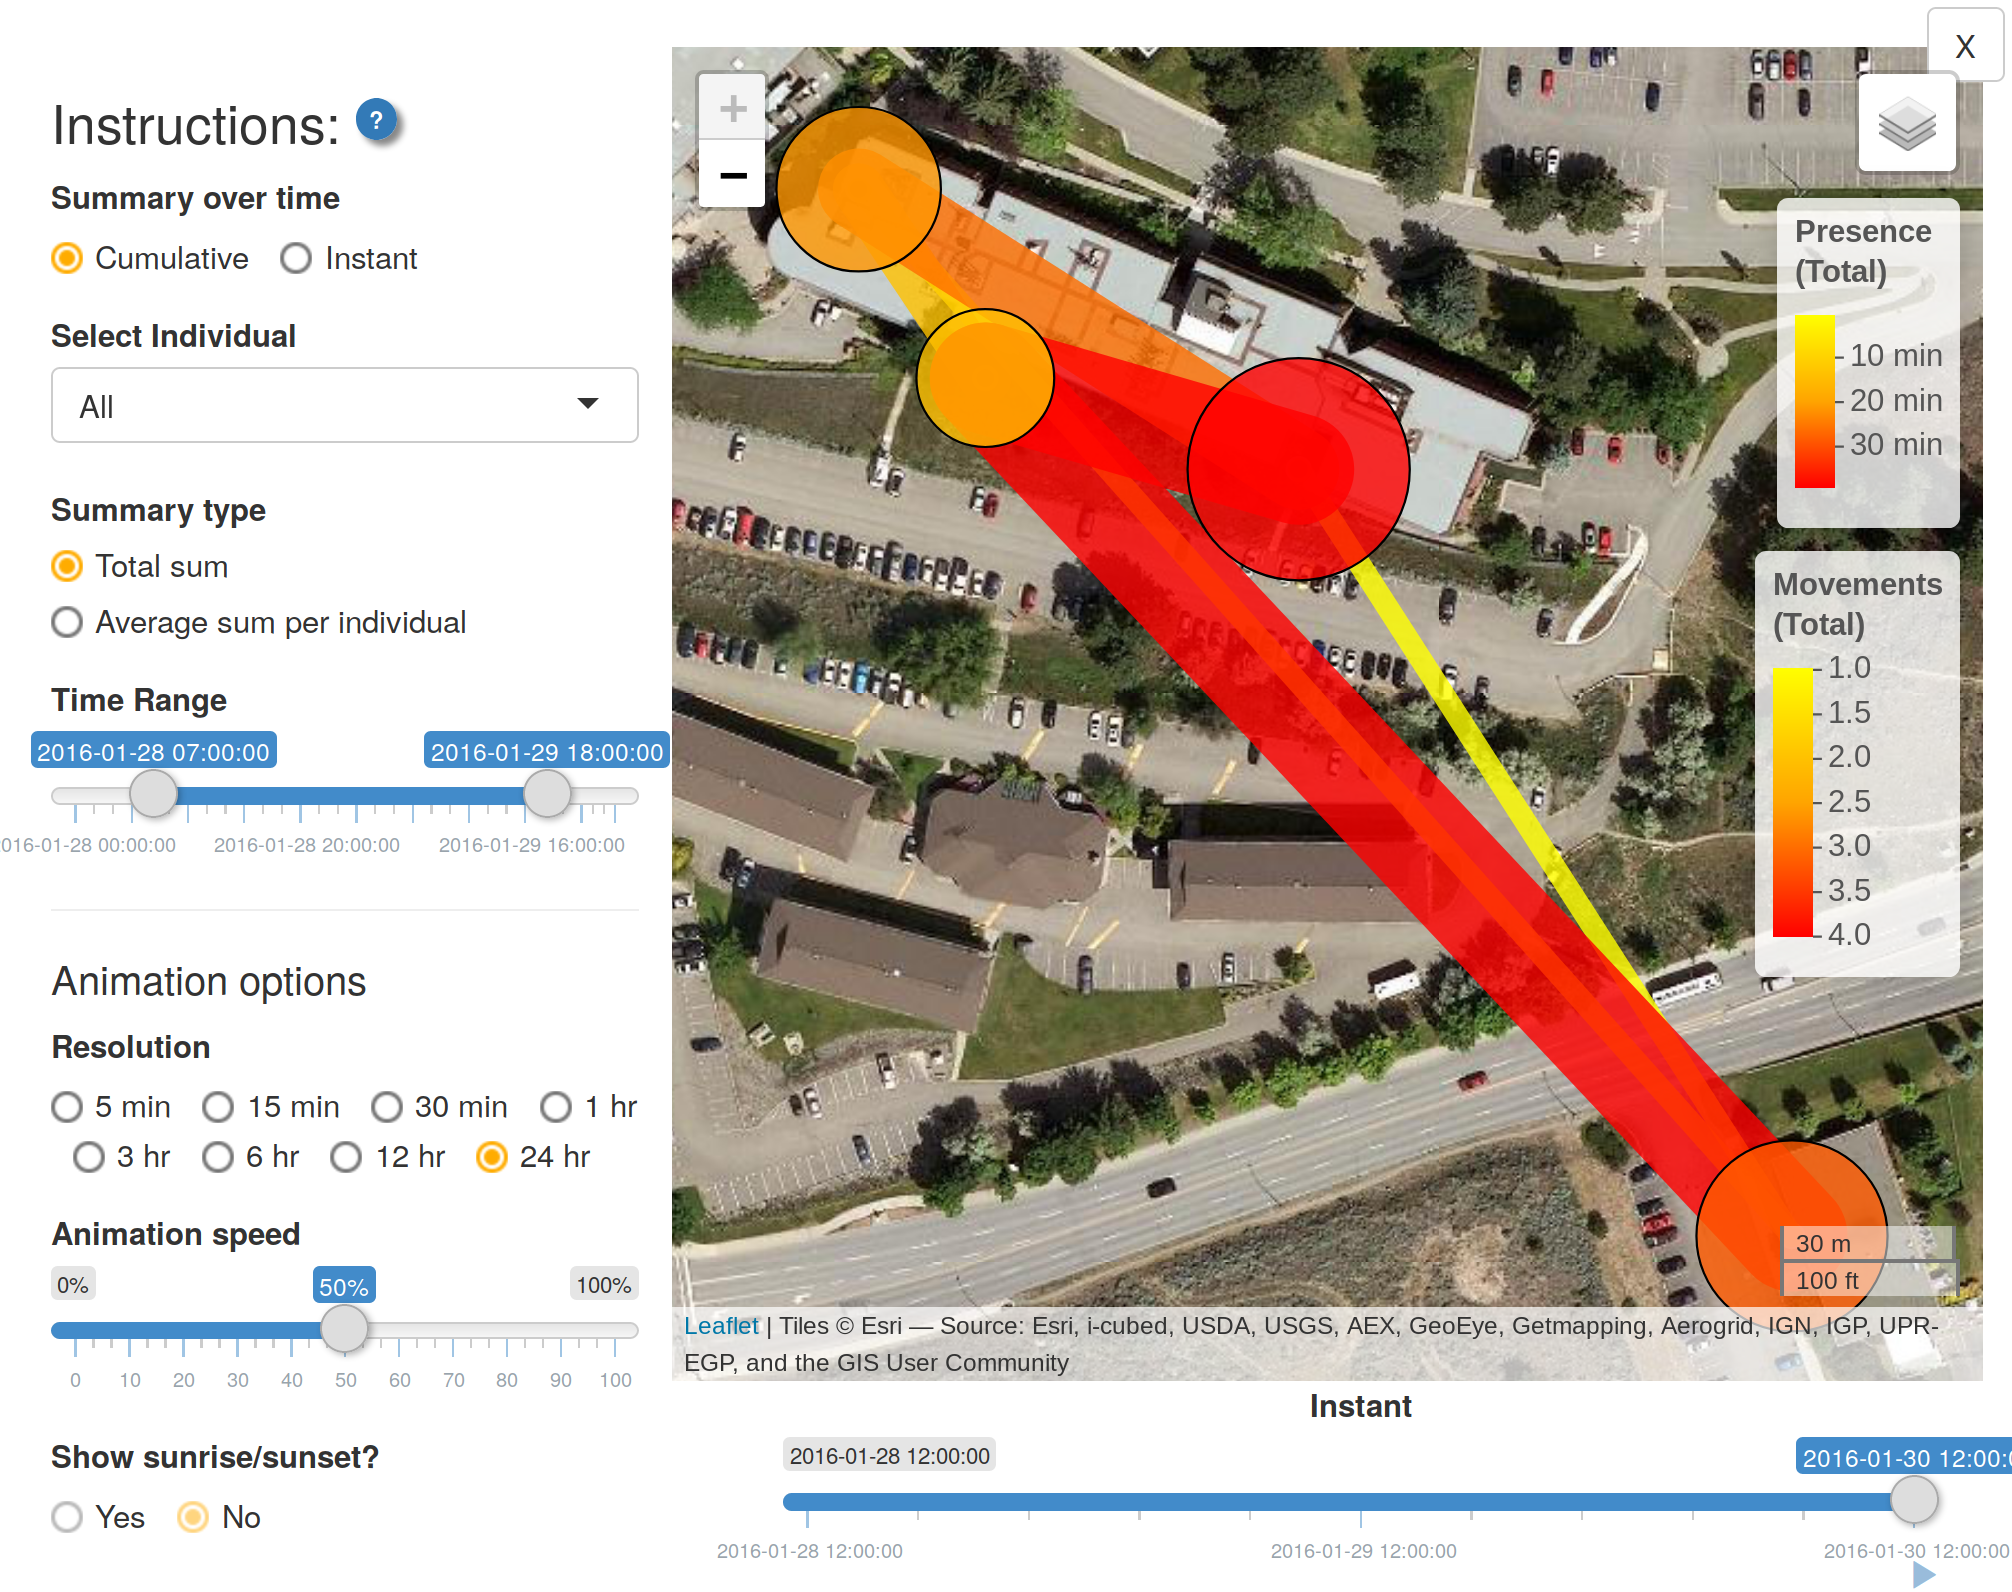  --- # Why ornithologists should use R ## Find More Packages! - Not an exhaustive list! - Check out package collections - [metaverse](https://rmetaverse.github.io/) (<https://rmetaverse.github.io/>) - [ropensci](https://ropensci.org/) (<https://ropensci.org/>) - [tidyverse](https://tidyverse.org/) (<https://tidyverse.org/>) - Look in journals, i.e. Methods in Ecology and Evolution - Look in methods sections of articles -- ![:spacer 30px]() > Always cite packages and package versions! --- # **Symposium:** R for Ornithologists ### Stay tuned for 6 more .rblue[R]-related presentations ### 2:00pm Round-Table Discussion on Ornithological perspectives on R -- ![:spacer 0px]() ## .rblue[Thank you!] **Thanks to Denis LePage for help on the French version**    ![:info v, right: 25px, bottom: 200px]()  .footer-right[Compiled on 2019-08-28] .footer[ Presentation Available: <https://steffilazerte.github.io/Presentations/> Slides created with the R package [xaringan](https://github.com/yihui/xaringan), using [remark.js](https://remarkjs.com), [knitr](http://yihui.name/knitr), and [R Markdown](https://rmarkdown.rstudio.com)]