56 * 5.8[1] 324.8Workshop: Dealing with Data in R
steffilazerte
@steffilazerte@fosstodon.org
@steffilazerte
steffilazerte.ca
![]()
Compiled: 2026-02-19


![]()
![]()
(I made these slides with a mix of R and Quarto)

Artwork by @allison_horst
mean(c(1, 2, 3, 4))[1] 2.5Code Output
 Script
# First load the packages
library(palmerpenguins)
library(ggplot2)
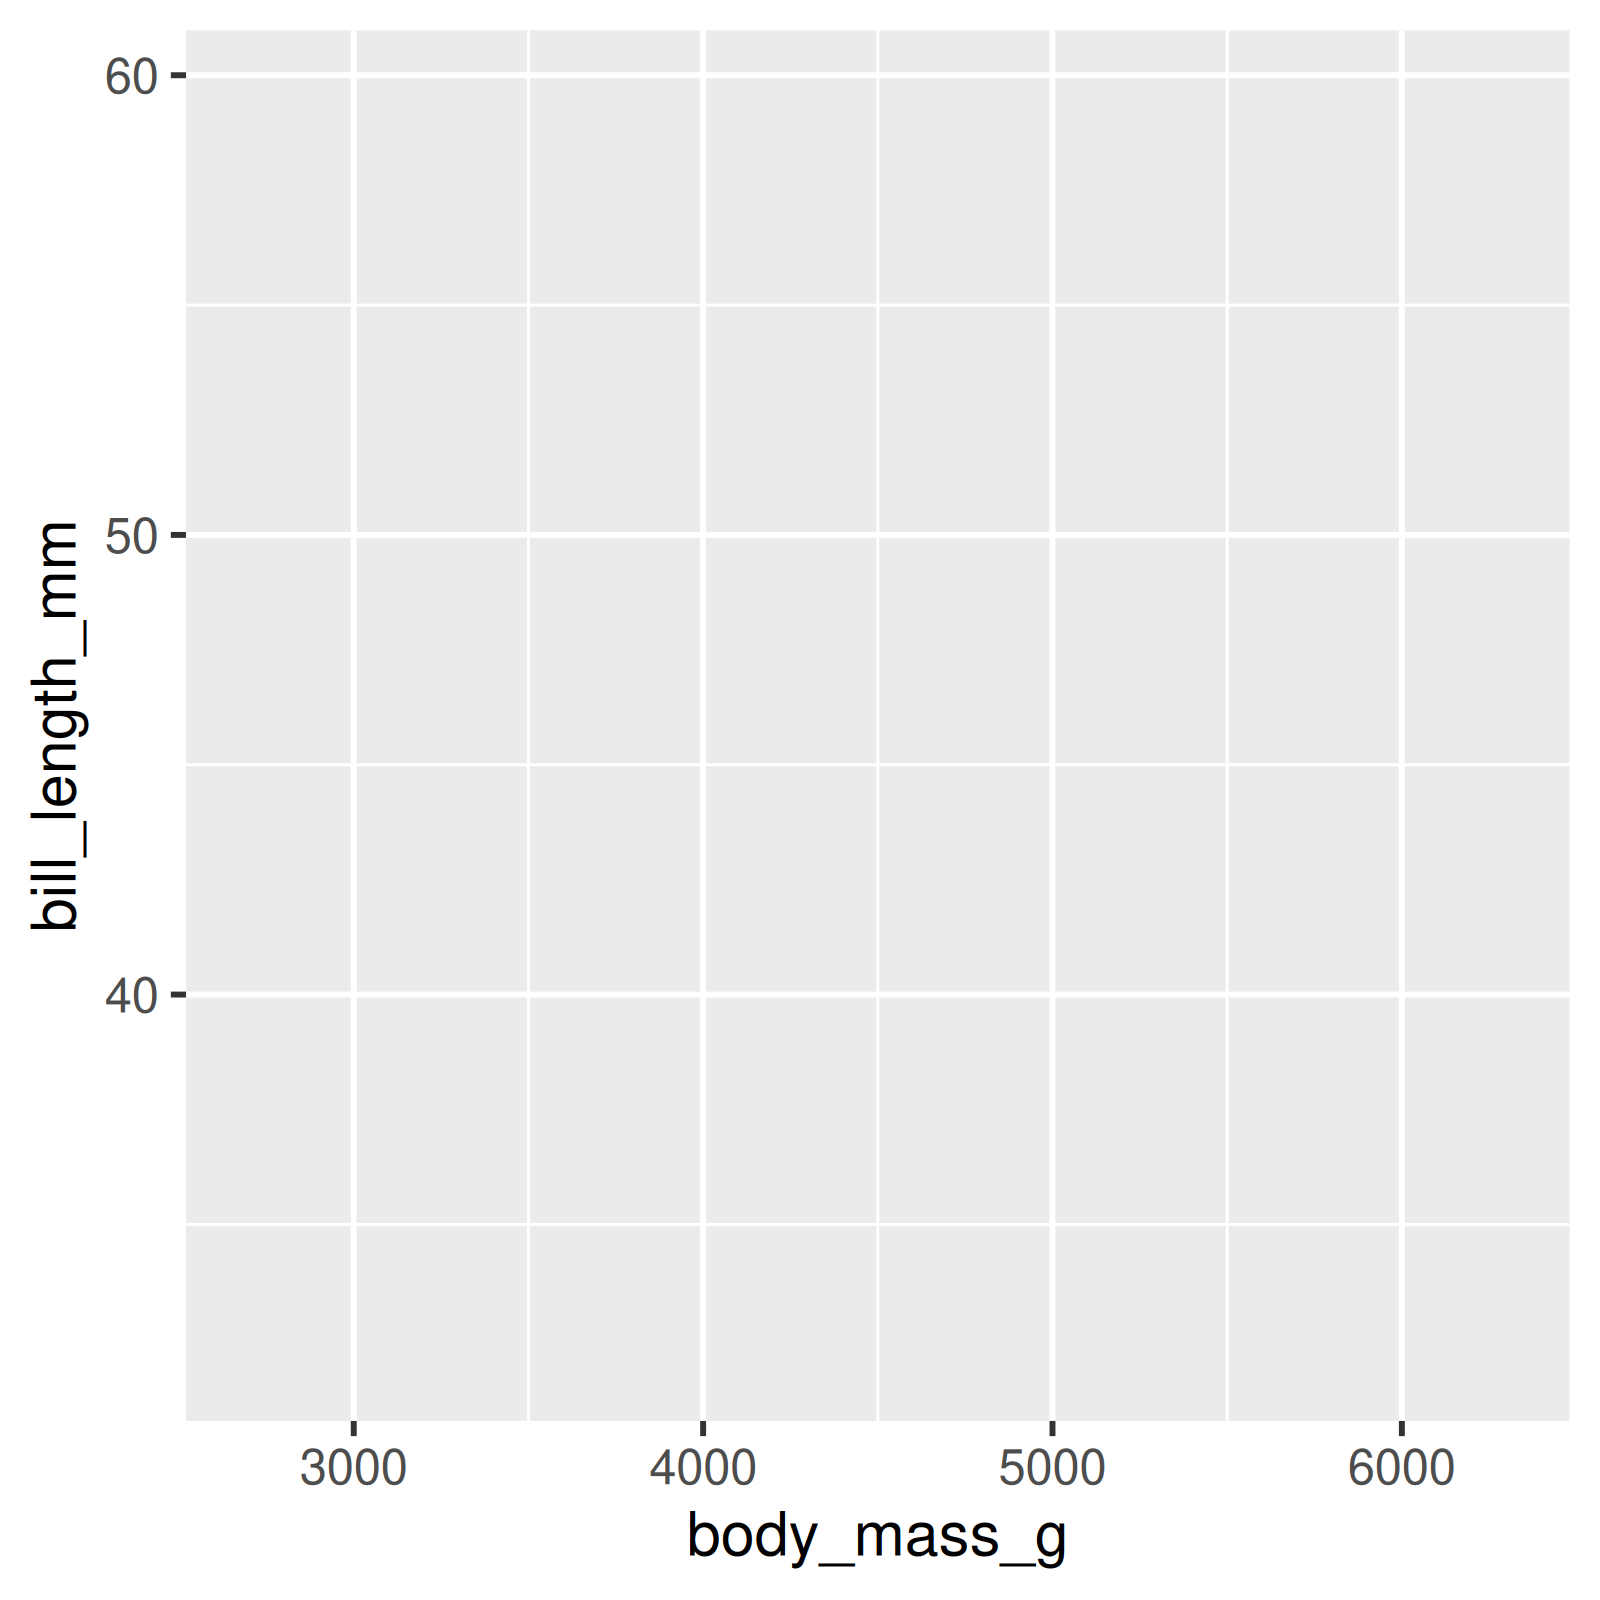
# Now create the figure
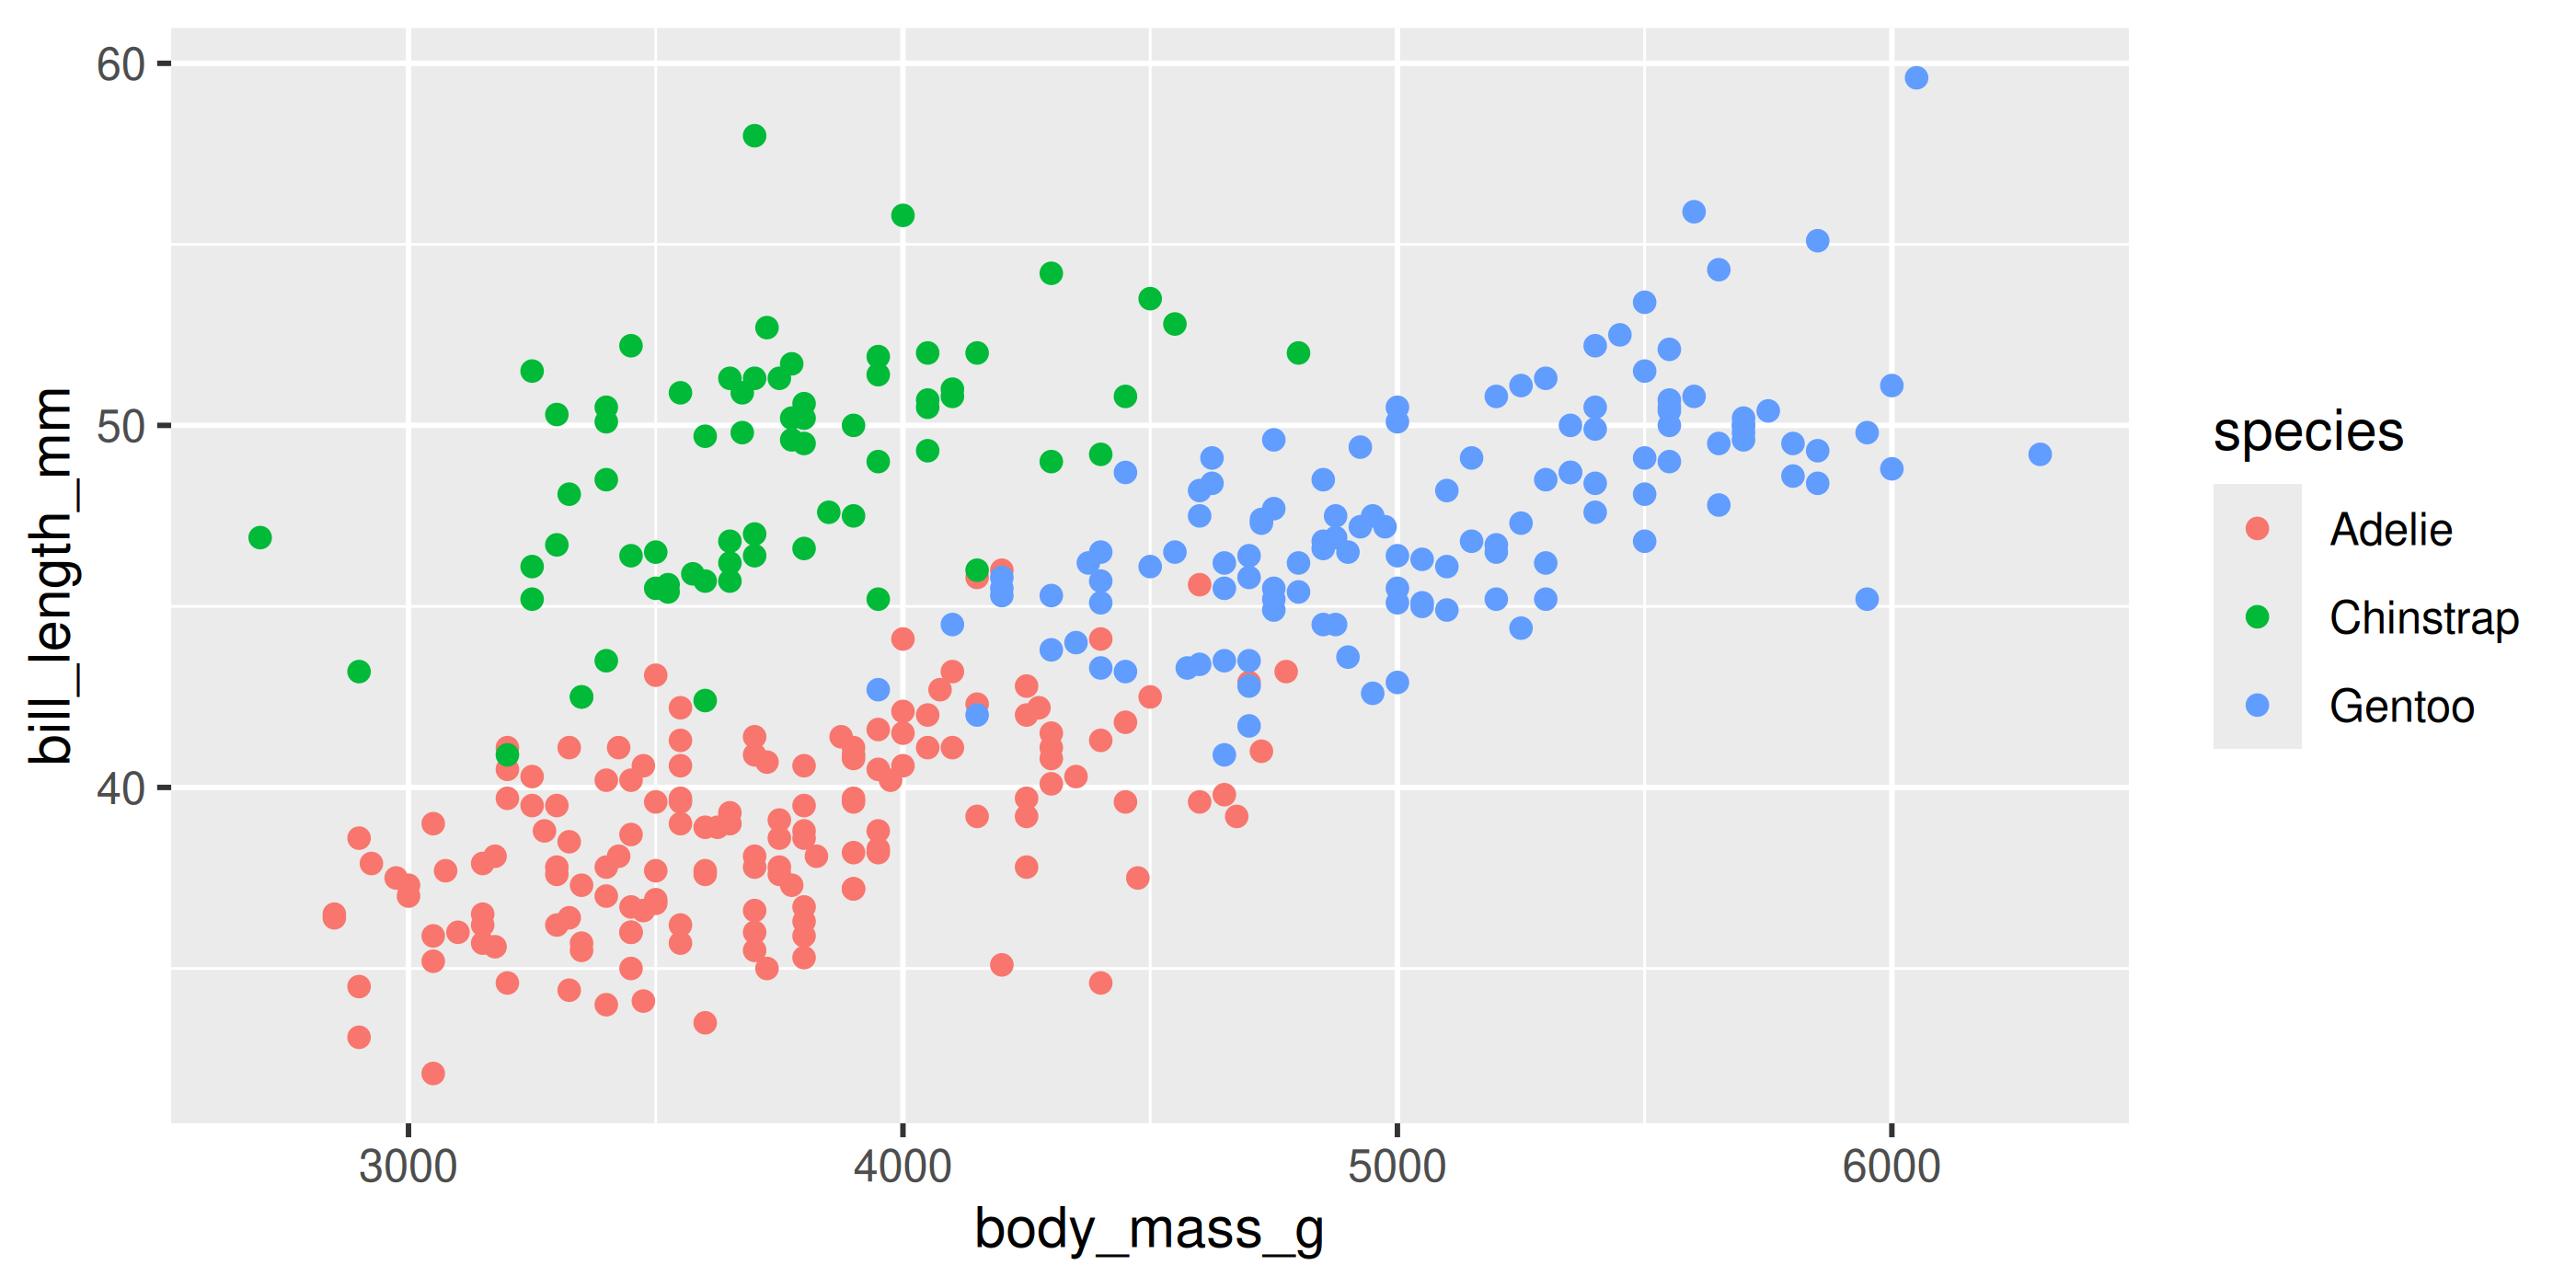
ggplot(data = penguins, aes(x = body_mass_g, y = bill_length_mm, colour = species)) +
geom_point()Warning: Removed 2 rows containing missing values or values outside the scale range
(`geom_point()`).# First load the packages
library(palmerpenguins)
library(ggplot2)
# Now create the figure
ggplot(data = penguins, aes(x = body_mass_g, y = bill_length_mm, colour = species)) +
geom_point()Warning: Removed 2 rows containing missing values or values outside the scale range
(`geom_point()`).Let’s talk about the parts of the code first
Later we’ll talk about why this works
# First load the packages
library(palmerpenguins)
library(ggplot2)

# Now create the figure
ggplot(data = penguins, aes(x = body_mass_g, y = bill_length_mm, colour = species)) +
  geom_point()
Warning: Removed 2 rows containing missing values or values outside the scale range
(`geom_point()`).Packagesggplot2 and palmerpenguins
# First load the packages
library(palmerpenguins)
library(ggplot2)

# Now create the figure
ggplot(data = penguins, aes(x = body_mass_g, y = bill_length_mm, colour = species)) +
  geom_point()
Warning: Removed 2 rows containing missing values or values outside the scale range
(`geom_point()`).Functionslibrary(), ggplot(), aes(), geom_point()
# First load the packages
library(palmerpenguins)
library(ggplot2)

# Now create the figure
ggplot(data = penguins, aes(x = body_mass_g, y = bill_length_mm, colour = species)) +
  geom_point()
Warning: Removed 2 rows containing missing values or values outside the scale range
(`geom_point()`).+
(Specific to ggplot)
# First load the packages
library(palmerpenguins)
library(ggplot2)

# Now create the figure
ggplot(data = penguins, aes(x = body_mass_g, y = bill_length_mm, colour = species)) +
  geom_point()
Warning: Removed 2 rows containing missing values or values outside the scale range
(`geom_point()`).Figure!
# First load the packages
library(palmerpenguins)
library(ggplot2)

# Now create the figure
ggplot(data = penguins, aes(x = body_mass_g, y = bill_length_mm, colour = species)) +
  geom_point()
Warning: Removed 2 rows containing missing values or values outside the scale range
(`geom_point()`).Warning
# First load the packages
library(palmerpenguins)
library(ggplot2)

# Now create the figure
ggplot(data = penguins, aes(x = body_mass_g, y = bill_length_mm, colour = species)) +
  geom_point()
Warning: Removed 2 rows containing missing values or values outside the scale range
(`geom_point()`).Comments
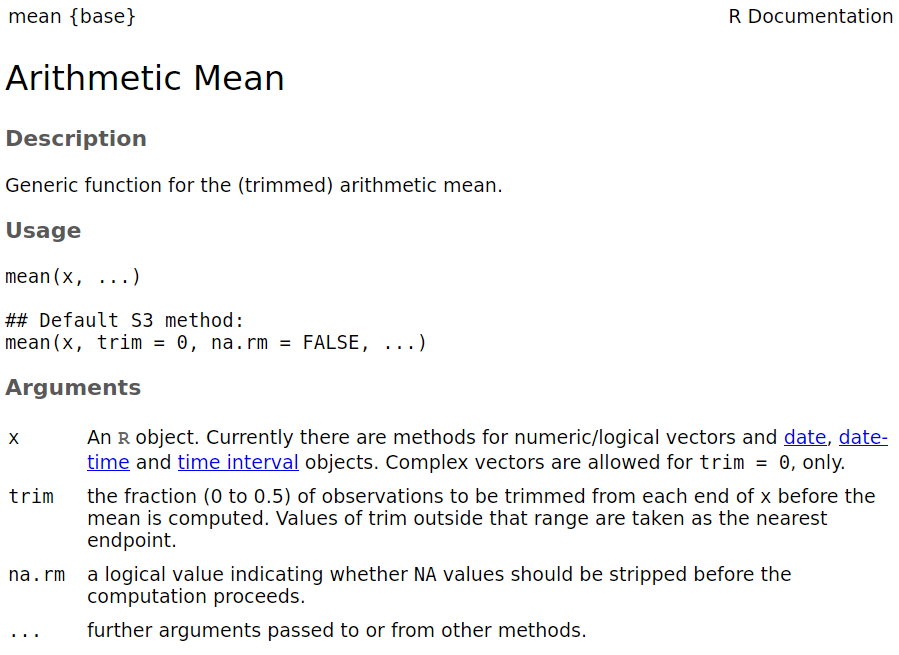
e.g., library() - Loads an R package so we can use it’s functions and other objects it supplies
Apple is not the same as apple)Artwork by @allison_horst
Artwork by @allison_horst