Workshop: Dealing with Data in R

Getting Started with R

Back to Basics

steffilazerte
@steffilazerte@fosstodon.org
@steffilazerte
steffilazerte.ca

Compiled: 2024-02-21

These are me and my creatures

This is my garden

Introductions

Dr. Steffi LaZerte

  • Background in Biology (Animal Behaviour)
  • Working with R since 2007
  • Professional R programmer/consultant
    since 2017
  • rOpenSci Community Assistant

Steffi smiling and holding a cat in her arms

Introductions

Dr. Alex Koiter (Today’s Teaching Assistant)

  • Physical Geographer
  • Working with R since 2010
  • Associate Professor in Geography and Environment,
    Brandon University

Steffi smiling and holding a cat in her arms

What about you?

  • Name
  • Background (Role, Area of study, etc.)
  • Familiarity with R or Programming
  • Creatures (furry, feathery, scaley, green or otherwise)?
Three very different looking dragons stand side by side. On the left, a very small blue dragon with spiky hair and no pattern. In the center, a green striped dragon. On the right, a large purple dragon with spots.

About this Workshop

Format

  • I will provide you tools and workflow to get started with R
  • We’ll have hands-on activities, lectures, and demonstrations
  • Video on or off, however works best for you!

Questions

  • Ask questions by un-muting, or ask in the chat (Alex will monitor)
    • Workshop-related questions we’ll address together
    • Specific, system-related problems, Alex will help you in the “Troubleshooting Room”

Getting help

R is hard: But have no fear!

  • Don’t expect to remember everything!
  • Copy/Paste is your friend (never apologize for using it!)
  • Consider this workshop a resource to return to
A frustrated little monster sits on the ground with his hat next to him, saying "I just need a minute." Looking on empathetically is the R logo, with the word "Error" in many different styles behind it.

What is R?

RStudio vs. R


RStudio blue ball logo

RStudio


R logo, blue R with grey circle around the back

R


  • RStudio is not R
  • RStudio is a User Interface or IDE (integrated development environment)
    • (i.e., Makes coding simpler)

Open RStudio

R is a Programming language

A programming language is a way to give instructions in order to get a computer to do something

  • You need to know the language (i.e., the code)
  • Computers don’t know what you mean, only what you type (unfortunately)
  • Spelling, punctuation, and capitalization all matter!

For example

R, what is 56 times 5.8?

56 * 5.8
[1] 324.8

Use code to tell R what to do

R, what is the average of numbers 1, 2, 3, 4?

mean(c(1, 2, 3, 4))
[1] 2.5

R, save this value for later

steffis_mean <- mean(c(1, 2, 3, 4))

R, multiply this value by 6

steffis_mean * 6
[1] 15

Why R?

R is hard

A complex R script

But R is powerful (and reproducible)!

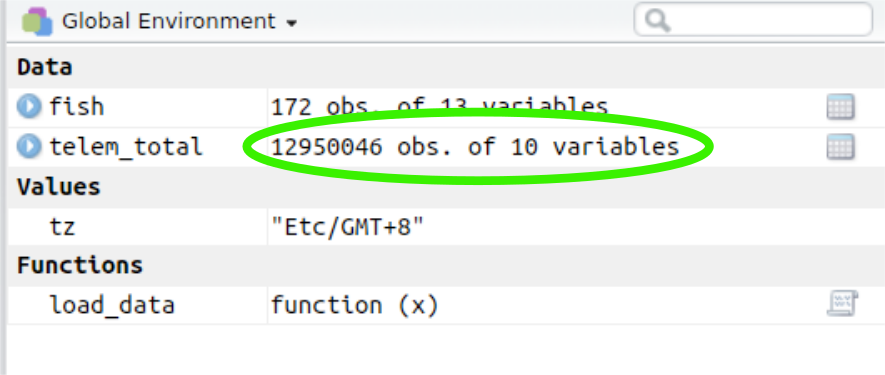
A screenshot of the R environment showing a data frame with 13 million observations

(I made these slides with a mix of R and Quarto)

R is also beautiful

A colourful map of Manitoba

R is affordable (i.e., free!)

Text reading: "R is available as Free Software under the terms of the Free Software Foundation's GNU General Public License in source code form. It compiles and runss on a wide variety of UNIX platforms and similar systems (including FreeBSD and Linux), Windows and MacOS.

ImpostR Syndrome

Text reading "Impost R Syndrome" with the Blue R logo for the 'R'

ImpostR Syndrome


Text reading "Impost R Syndrome" with the Blue R logo for the 'R'

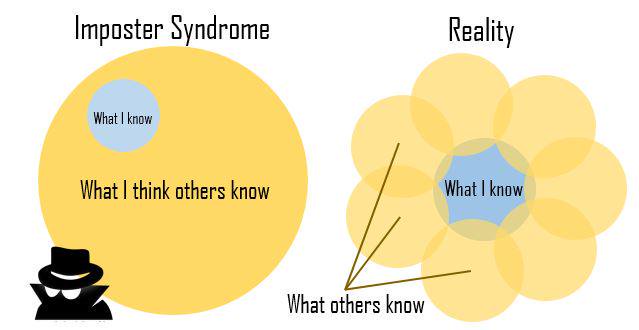
Two yellow circles. The one on the left has 'Imposter Syndrome' written above. Inside this yellow circle it says 'What I think others know', inside a small blue circle reads 'What I know'. The yellow circle on the right has 'Reality' written above. This yellow circle is made up of many small yellow circles with the label 'What others know', surrounding a small blue circle which reads 'What I know'

David Whittaker

Moral of the story?

Make friends, code in groups, learn together and don’t beat yourself up
The Goal

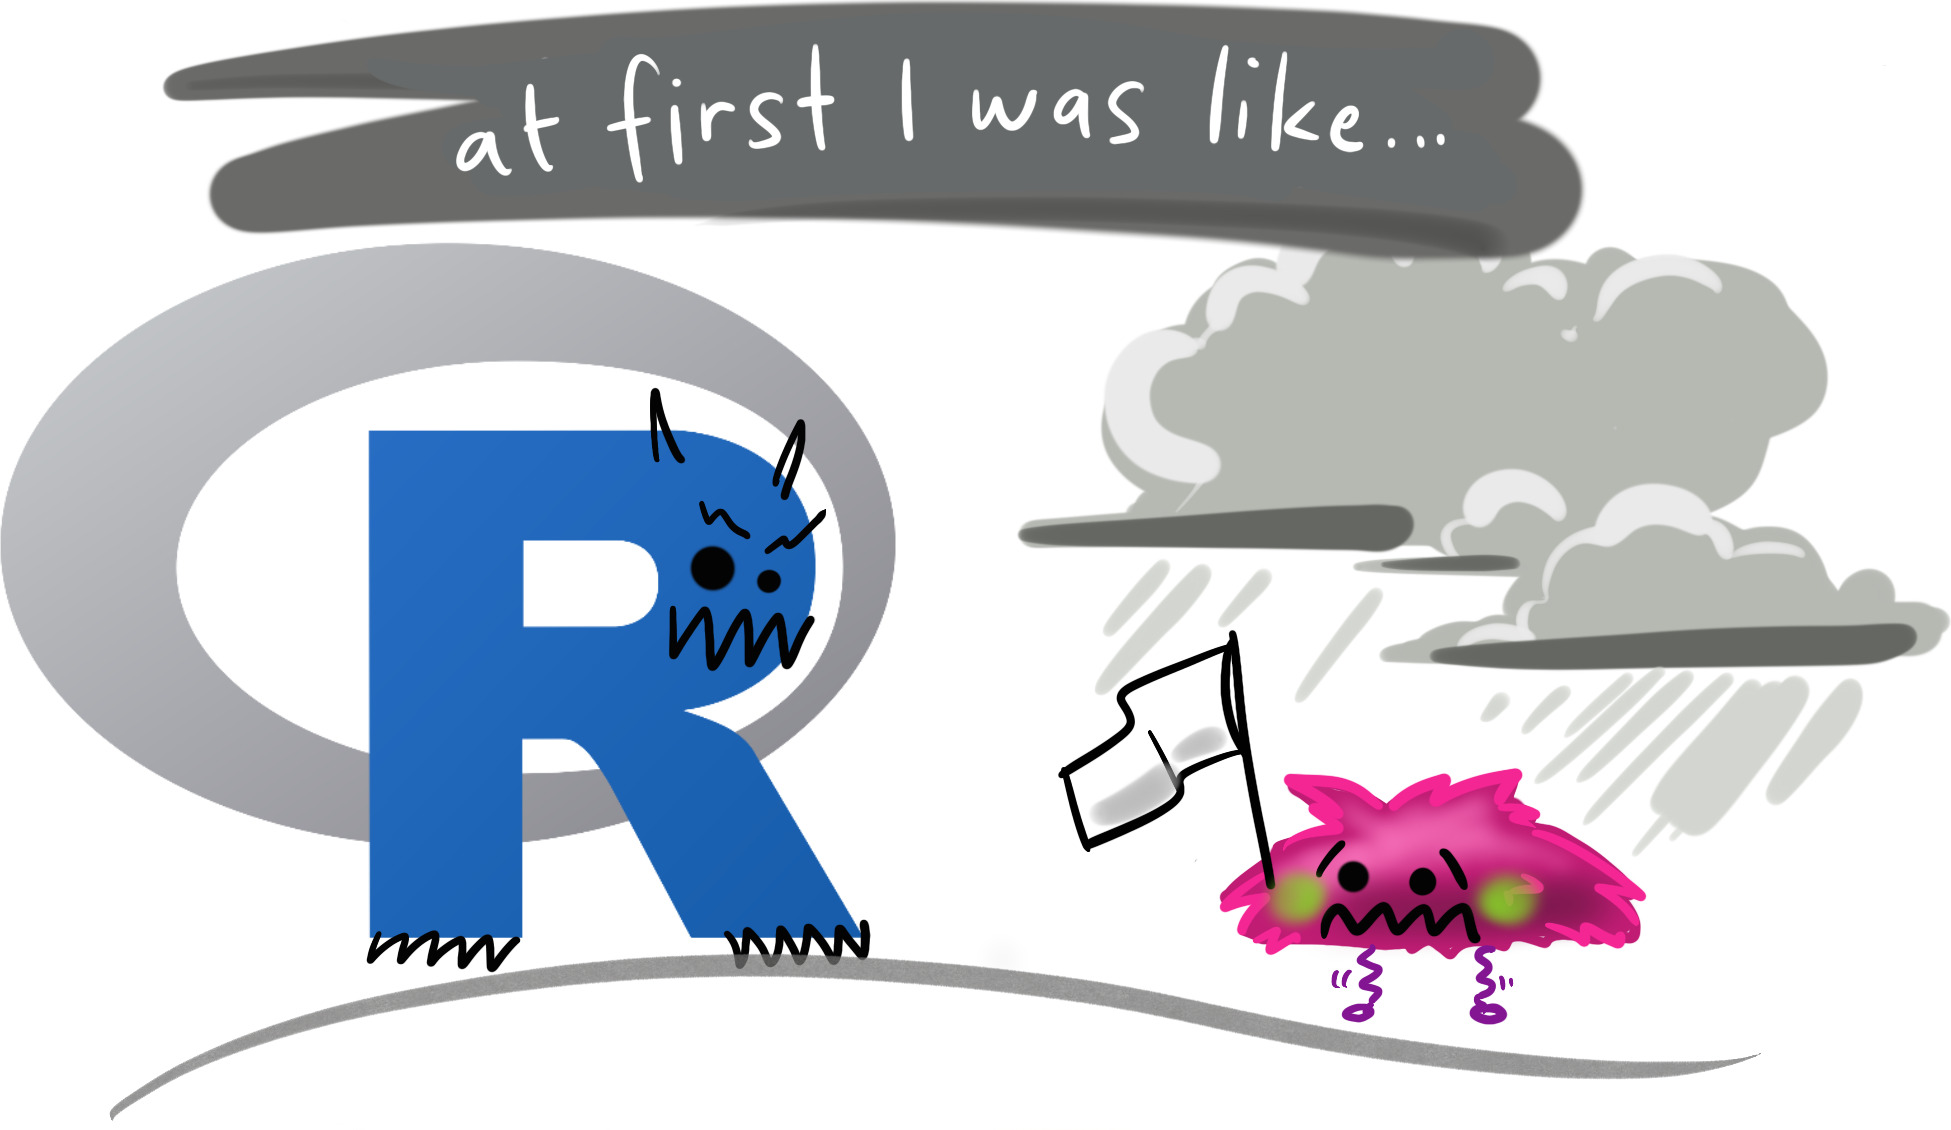
An R-logo with a scary face, and a small scared little fuzzy monster holding up a white flag in surrender while under a dark storm cloud. The text above says "at first I was like…"

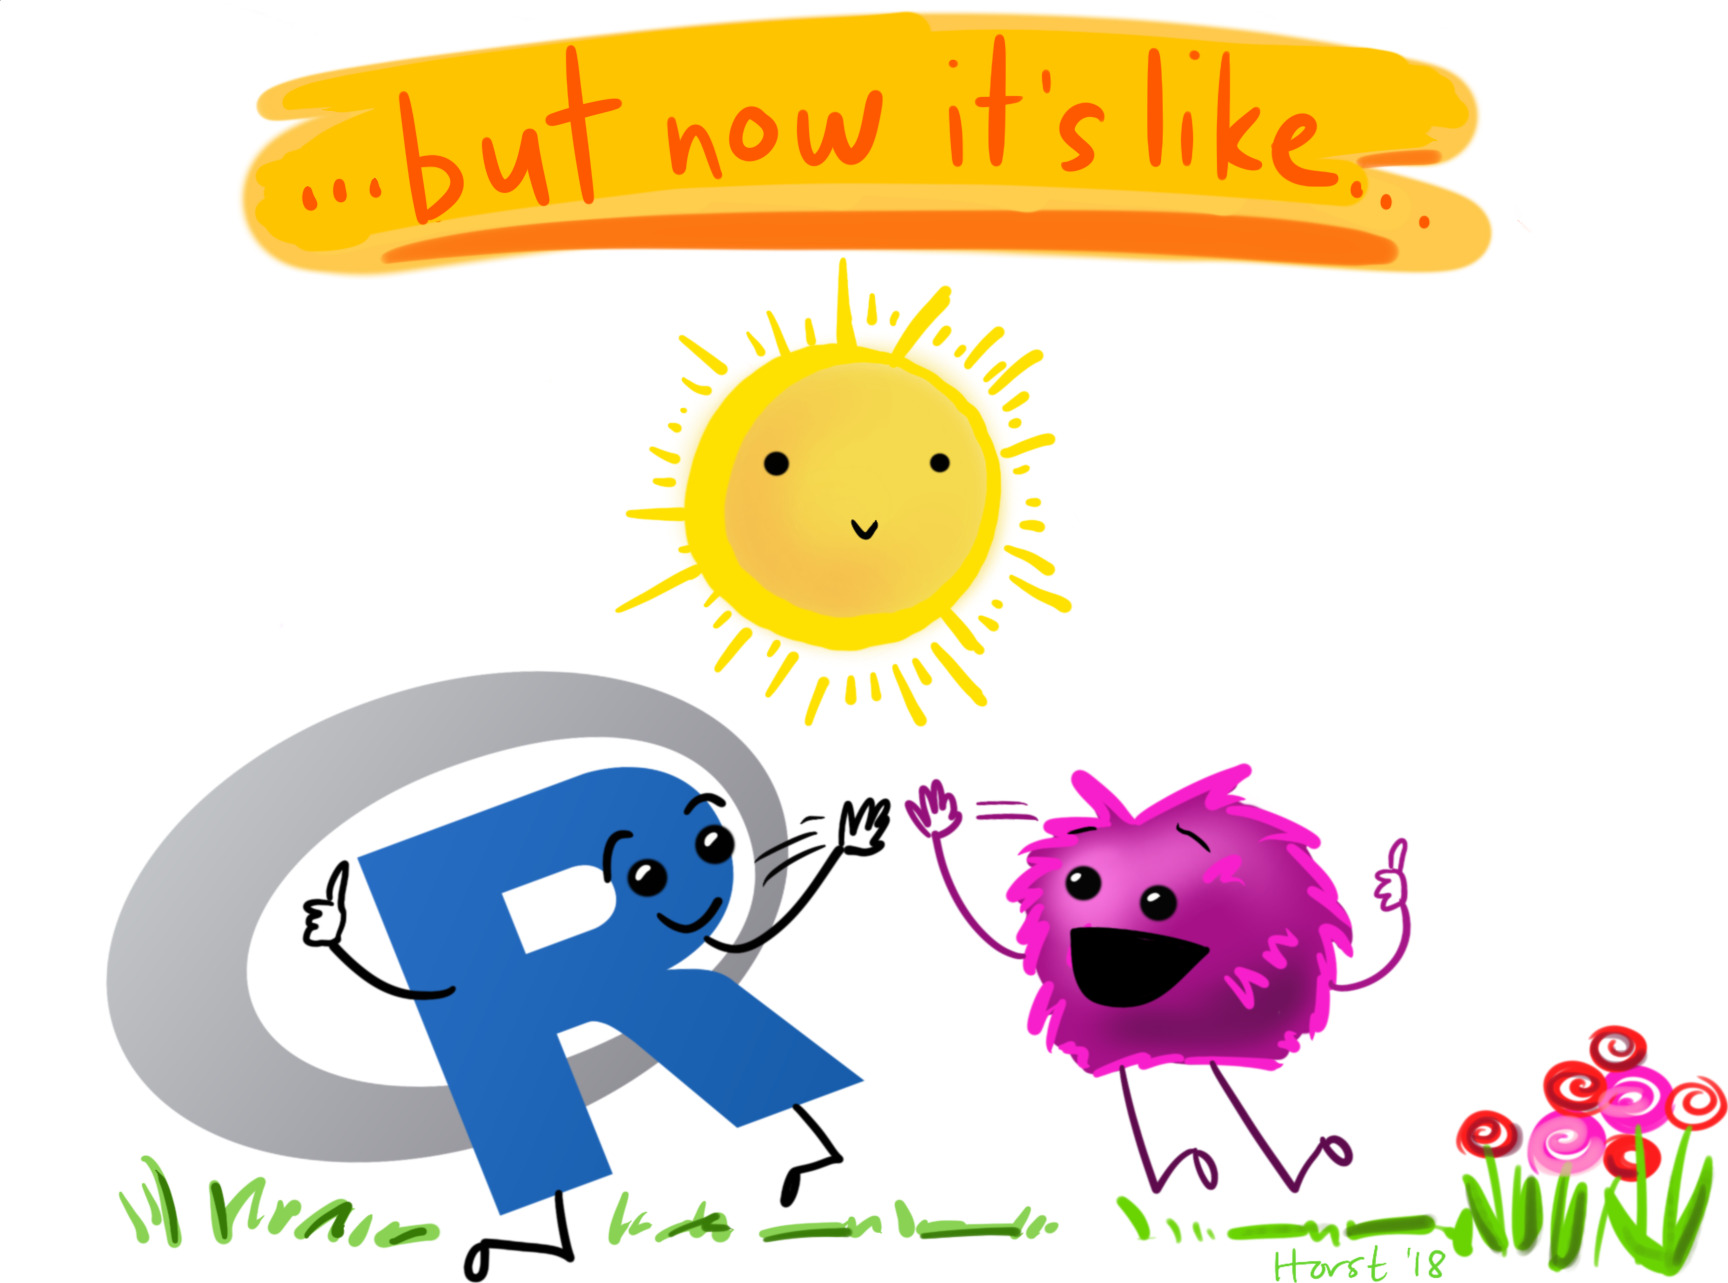
Artwork by @allison_horst

A friendly, smiling R-logo jumping up to give a happy fuzzy monster a high-five under a smiling sun and next to colorful flowers. The text above reads "but now it’s like…"

About R

Code, Output, Scripts

Code

  • The actual commands

Output

  • The result of running code or a script

Script

  • A text file full of code that you want to run
  • You should always keep your code in a script

For example:

mean(c(1, 2, 3, 4))
[1] 2.5

Code Output

A screenshot of a script in the RStudio window: many lines of code in a file called '4_analysis.R' Script

RStudio Features

Projects

  • Handles working directories
  • Organizes your work

Let’s setup a project in RStudio!

Changing Options: Tools > Global Options

  • General > Restore RData into workspace at startup (NO!)
  • General > Save workspace to on exit (NEVER!)
  • Code > Insert matching parens/quotes (Personal preference)

Let’s change some options in RStudio!

Packages

  • Can use the package manager to install packages
  • Can use the manager to load them as well, but not recommended

Getting Ready

Open New File
(make sure you’re in the RStudio Project)

Write library(tidyverse) at the top

Save this new script
(consider names like intro.R or 1_getting_started.R)

Your first real code!

First Code

# First load the packages
library(palmerpenguins)
library(ggplot2)

# Now create the figure
ggplot(data = penguins, aes(x = body_mass_g, y = bill_length_mm, colour = species)) +
  geom_point()
  1. Copy/paste or type this into the script window in RStudio
    • You may have to go to File > New File > R Script
  2. Click on the first line of code
  3. Run the code
    • Click ‘Run’ button (upper right) or
    • Use the short-cut Ctrl-Enter
  4. Repeat until all the code has run

First Code

# First load the packages
library(palmerpenguins)
library(ggplot2)

# Now create the figure
ggplot(data = penguins, aes(x = body_mass_g, y = bill_length_mm, colour = species)) +
  geom_point()
Warning: Removed 2 rows containing missing values (`geom_point()`).
A scatterplot showing bill_length_mm by body_mass_g with points in three colours corresponding to three differen species

Packages
ggplot2 and palmerpenguins

First Code

# First load the packages
library(palmerpenguins)
library(ggplot2)

# Now create the figure
ggplot(data = penguins, aes(x = body_mass_g, y = bill_length_mm, colour = species)) +
  geom_point()
Warning: Removed 2 rows containing missing values (`geom_point()`).
A scatterplot showing bill_length_mm by body_mass_g with points in three colours corresponding to three differen species

Functions
library(), ggplot(), aes(), geom_point()

First Code

# First load the packages
library(palmerpenguins)
library(ggplot2)

# Now create the figure
ggplot(data = penguins, aes(x = body_mass_g, y = bill_length_mm, colour = species)) +
  geom_point()
Warning: Removed 2 rows containing missing values (`geom_point()`).
A scatterplot showing bill_length_mm by body_mass_g with points in three colours corresponding to three differen species

+
(Specific to ggplot)

First Code

# First load the packages
library(palmerpenguins)
library(ggplot2)

# Now create the figure
ggplot(data = penguins, aes(x = body_mass_g, y = bill_length_mm, colour = species)) +
  geom_point()
Warning: Removed 2 rows containing missing values (`geom_point()`).
A scatterplot showing bill_length_mm by body_mass_g with points in three colours corresponding to three differen species

Figure!

First Code

# First load the packages
library(palmerpenguins)
library(ggplot2)

# Now create the figure
ggplot(data = penguins, aes(x = body_mass_g, y = bill_length_mm, colour = species)) +
  geom_point()
Warning: Removed 2 rows containing missing values (`geom_point()`).
A scatterplot showing bill_length_mm by body_mass_g with points in three colours corresponding to three differen species

Warning

First Code

# First load the packages
library(palmerpenguins)
library(ggplot2)

# Now create the figure
ggplot(data = penguins, aes(x = body_mass_g, y = bill_length_mm, colour = species)) +
  geom_point()
Warning: Removed 2 rows containing missing values (`geom_point()`).
A scatterplot showing bill_length_mm by body_mass_g with points in three colours corresponding to three differen species

Comments

R Basics: Objects

Objects are things in the environment

(Check out the Environment pane in RStudio)

functions()

Do things, Return things

Does something but returns nothing

e.g., library() - Loads an R package so we can use it’s functions and other objects it supplies

library(palmerpenguins)

Does something and returns something

e.g., ggplot() - Creates and returns a basic plot

ggplot(data = penguins, aes(x = body_mass_g, y = bill_length_mm))

functions()

  • Functions can take arguments (think ‘options’)
  • data, x, y, colour
ggplot(data = penguins, aes(x = body_mass_g, y = bill_length_mm, colour = species)) +
  geom_point()
  • Arguments defined by name or by position
  • With correct position, do not need to specify by name

By name:

mean(x = c(1, 5, 10))
[1] 5.333333

By order:

mean(c(1, 5, 10))
[1] 5.333333

functions()

Watch out for ‘hidden’ arguments

By name:

mean(x = c(1, 5, 10, NA), 
     na.rm = TRUE)
[1] 5.333333

By order:

mean(c(1, 5, 10, NA), 
     TRUE)
Error in mean.default(c(1, 5, 10, NA), TRUE): 'trim' must be numeric of length one

This error states that we’ve assigned the argument trim to a non-valid argument

Where did trim come from?
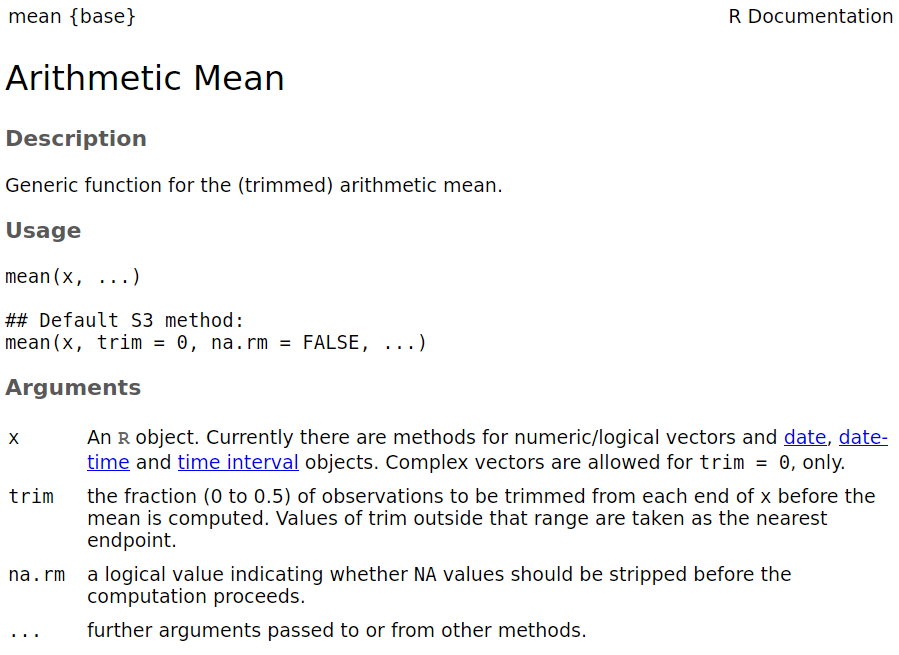
R documentation

?mean

A screenshot of the documenation produced by running ?mean in the R console

Data

  • Generally kept in vectors or data.frames (also tibbles)
  • These are objects with names (like functions)
  • Here are two built-in examples (part of R)

Vector (1 dimension)

month.name
 [1] "January"   "February"  "March"    
 [4] "April"     "May"       "June"     
 [7] "July"      "August"    "September"
[10] "October"   "November"  "December" 

Data frame (2 dimensions)

mtcars
                     mpg cyl  disp  hp drat    wt  qsec vs
Mazda RX4           21.0   6 160.0 110 3.90 2.620 16.46  0
Mazda RX4 Wag       21.0   6 160.0 110 3.90 2.875 17.02  0
Datsun 710          22.8   4 108.0  93 3.85 2.320 18.61  1
Hornet 4 Drive      21.4   6 258.0 110 3.08 3.215 19.44  1
Hornet Sportabout   18.7   8 360.0 175 3.15 3.440 17.02  0
Valiant             18.1   6 225.0 105 2.76 3.460 20.22  1
Duster 360          14.3   8 360.0 245 3.21 3.570 15.84  0
Merc 240D           24.4   4 146.7  62 3.69 3.190 20.00  1
Merc 230            22.8   4 140.8  95 3.92 3.150 22.90  1
Merc 280            19.2   6 167.6 123 3.92 3.440 18.30  1
Merc 280C           17.8   6 167.6 123 3.92 3.440 18.90  1
Merc 450SE          16.4   8 275.8 180 3.07 4.070 17.40  0
Merc 450SL          17.3   8 275.8 180 3.07 3.730 17.60  0
Merc 450SLC         15.2   8 275.8 180 3.07 3.780 18.00  0
Cadillac Fleetwood  10.4   8 472.0 205 2.93 5.250 17.98  0
Lincoln Continental 10.4   8 460.0 215 3.00 5.424 17.82  0
Chrysler Imperial   14.7   8 440.0 230 3.23 5.345 17.42  0
Fiat 128            32.4   4  78.7  66 4.08 2.200 19.47  1
Honda Civic         30.4   4  75.7  52 4.93 1.615 18.52  1
Toyota Corolla      33.9   4  71.1  65 4.22 1.835 19.90  1
Toyota Corona       21.5   4 120.1  97 3.70 2.465 20.01  1
Dodge Challenger    15.5   8 318.0 150 2.76 3.520 16.87  0
AMC Javelin         15.2   8 304.0 150 3.15 3.435 17.30  0
Camaro Z28          13.3   8 350.0 245 3.73 3.840 15.41  0
Pontiac Firebird    19.2   8 400.0 175 3.08 3.845 17.05  0
Fiat X1-9           27.3   4  79.0  66 4.08 1.935 18.90  1
Porsche 914-2       26.0   4 120.3  91 4.43 2.140 16.70  0
Lotus Europa        30.4   4  95.1 113 3.77 1.513 16.90  1
Ford Pantera L      15.8   8 351.0 264 4.22 3.170 14.50  0
Ferrari Dino        19.7   6 145.0 175 3.62 2.770 15.50  0
Maserati Bora       15.0   8 301.0 335 3.54 3.570 14.60  0
Volvo 142E          21.4   4 121.0 109 4.11 2.780 18.60  1
                    am gear carb
Mazda RX4            1    4    4
Mazda RX4 Wag        1    4    4
Datsun 710           1    4    1
Hornet 4 Drive       0    3    1
Hornet Sportabout    0    3    2
Valiant              0    3    1
Duster 360           0    3    4
Merc 240D            0    4    2
Merc 230             0    4    2
Merc 280             0    4    4
Merc 280C            0    4    4
Merc 450SE           0    3    3
Merc 450SL           0    3    3
Merc 450SLC          0    3    3
Cadillac Fleetwood   0    3    4
Lincoln Continental  0    3    4
Chrysler Imperial    0    3    4
Fiat 128             1    4    1
Honda Civic          1    4    2
Toyota Corolla       1    4    1
Toyota Corona        0    3    1
Dodge Challenger     0    3    2
AMC Javelin          0    3    2
Camaro Z28           0    3    4
Pontiac Firebird     0    3    2
Fiat X1-9            1    4    1
Porsche 914-2        1    5    2
Lotus Europa         1    5    2
Ford Pantera L       1    5    4
Ferrari Dino         1    5    6
Maserati Bora        1    5    8
Volvo 142E           1    4    2
  • Columns have different types of variables

rows x columns

Your Turn: Vectors and Data frames

Try out the following code…

  • Here we will make a vector and a data frame
  • What is the output in your console?
  • How does your environment change (upper right panel)?

Vectors

a <- c("apples", 12, "pears", 5, 8)
a

Data frames

my_data <- data.frame(x = c("s1", "s2", "s3", "s4"),
                      y = c(101, 102, 103, 104),
                      z = c("a", "b", "c", "d"))
my_data

Your Turn: Vectors and Data frames

Try out the following code…

  • What does : do?
  • What does c() do?
  • Why use a comma with data frames?

Vectors

  • Use [index] to access part of a vector
  • Can access multiple parts at once
a[2]
a[2:5]     # What does : do?
a[c(1, 3)] # What does c() do?

Data frames

  • x$colname to pull columns out as vector
  • x[row, col] to access rows/columns
my_data[3, ]   # Why the comma?
my_data[3, 1]
my_data[, 1:2]

Your Turn: Vectors and Data frames

Try out the following code…

Vectors

a[2]
[1] "12"
a[2:5]     # What does : do?
[1] "12"    "pears" "5"     "8"    
a[c(1, 3)] # What does c() do?
[1] "apples" "pears" 

Data frames

my_data[3, ]   # Why the comma?
   x   y z
3 s3 103 c
my_data[3, 1]
[1] "s3"
my_data[, 1:2]
   x   y
1 s1 101
2 s2 102
3 s3 103
4 s4 104

Miscellaneous

R has spelling and punctuation

  • R cares about spelling
  • R is also case sensitive! (Apple is not the same as apple)
Comic panels of an alligator trying to debug some code. First panel: A confident looking alligator gets an error message. Second panel: a few minutes later, the error remains and the alligator is looking carefully at their code. Third panel: 10 minutes after that, the error remains and the alligator is giving a frustrated "RAAAR" while desperately typing. Fourth panel: The error remains, and the alligator looks exhausted and exasperated, and a thought bubble reads "maybe it's a bug." Fifth panel: A friendly flamingo comes over to take a look, and reads aloud from the problematic code a spelling error: "L-E-N-G-H-T." Only the tail of the alligator is visible as it stomp stomp stomps out of the panel roaring.

Artwork by @allison_horst

R has spelling and punctuation

  • Commas are used to separate arguments in functions

This is correct:

mean(c(5, 7, 10))  # [1] 7.333333

This is not correct:

mean(c(5 7 10))

>80% of learning R is learning to troubleshoot!

R has spelling and punctuation

Spaces usually don’t matter unless they change meanings

5>=6    # [1] FALSE
5 >=6   # [1] FALSE
5 >= 6  # [1] FALSE
5 > = 6 # Error: unexpected '=' in "5 > ="

Periods don’t matter either, but can be used in the same way as letters

(But don’t)

apple.oranges <- "fruit"

Assignments and Equal signs

Use <- to assign values to objects

a <- "hello"

Use = to set function arguments

mean(x = c(4, 9, 10))

Use == to determine equivalence (logical)

10 == 10 # [1] TRUE
10 == 9  # [1] FALSE

Braces/Brackets

Round brackets: ()

  • Identify functions (even if there are no arguments)
Sys.Date() # Get the Current Date
[1] "2024-02-21"
  • Without the (), R spits out information on the function:
Sys.Date
function () 
as.Date(as.POSIXlt(Sys.time()))
<bytecode: 0x561fe69e47b8>
<environment: namespace:base>

() must be associated with a function (Well, almost always)

Square brackets: []

  • Extract parts of objects
LETTERS
 [1] "A" "B" "C" "D" "E" "F" "G" "H" "I" "J" "K" "L" "M" "N" "O" "P" "Q" "R" "S"
[20] "T" "U" "V" "W" "X" "Y" "Z"
LETTERS[1]
[1] "A"
LETTERS[26]
[1] "Z"

[] have to be associated with an object that has dimensions (Always!)

Improving code readability

Use spaces like you would in sentences:

a <- mean(c(4, 10, 13))

is easier to read than

a<-mean(c(4,10,13))

(But the same, coding-wise)

Improving code readability

Don’t be afraid to use line breaks (‘Enters’) to make the code more readable

Hard to read

a <- data.frame(exp = c("A", "B", "A", "B", "A", "B"), sub = c("A1", "A1", "A2", "A2", "A3", "A3"), res = c(10, 12, 45, 12, 12, 13))

Easier to read

a <- data.frame(exp = c("A", "B", "A", "B", "A", "B"), 
                sub = c("A1", "A1", "A2", "A2", "A3", "A3"), 
                res = c(10, 12, 45, 12, 12, 13))

(But the same, coding-wise)

Let’s go!

A friendly, smiling R-logo jumping up to give a happy fuzzy monster a high-five under a smiling sun and next to colorful flowers. The text above reads "but now it’s like…"

Artwork by @allison_horst