Error:
! object 'a' not foundWorkshop: Dealing with Data in R
Getting Help with R
After this workshop
steffilazerte
@steffilazerte@fosstodon.org
@steffilazerte
steffilazerte.ca
![]()
Compiled: 2026-03-03
Tutorials
Vignettes are also online
Organizations/Websites

Communities!
- rOpenSci
- Social Media
- #RStats Twitter
- #RStats Mastodon (e.g., Fosstodon.org or Hachyderm.io)
- Data Carpentry Lessons
- Data Science Learning Community on Slack
(ask any question, they’re really nice!)
Specific Groups


Examples
On the web
- Nice to see expected output
- Helps figure out if it’s your system or your code
AI (specifically LLMs) ✨
General Cautions
- Can be useful, can be painful
- Free models are so-so
- R changes fast, so AI answers can be out of date
- Own your work

AI (specifically LLMs) ✨
Good usecases: Use AI to…
- Support your work, not do you work
- Remind yourself (enhanced search)
- Help troubleshooting
- Rubber duck that answers back
- Even incorrect answers can help
- Ask for suggestions for improvement
Bad usecases: Do NOT use AI to…
- Create code you can’t evaluate (Too soon)
- Have AI create code you don’t evaluate (Too fast)
- Work with private/sensitive data

Reproducible Examples
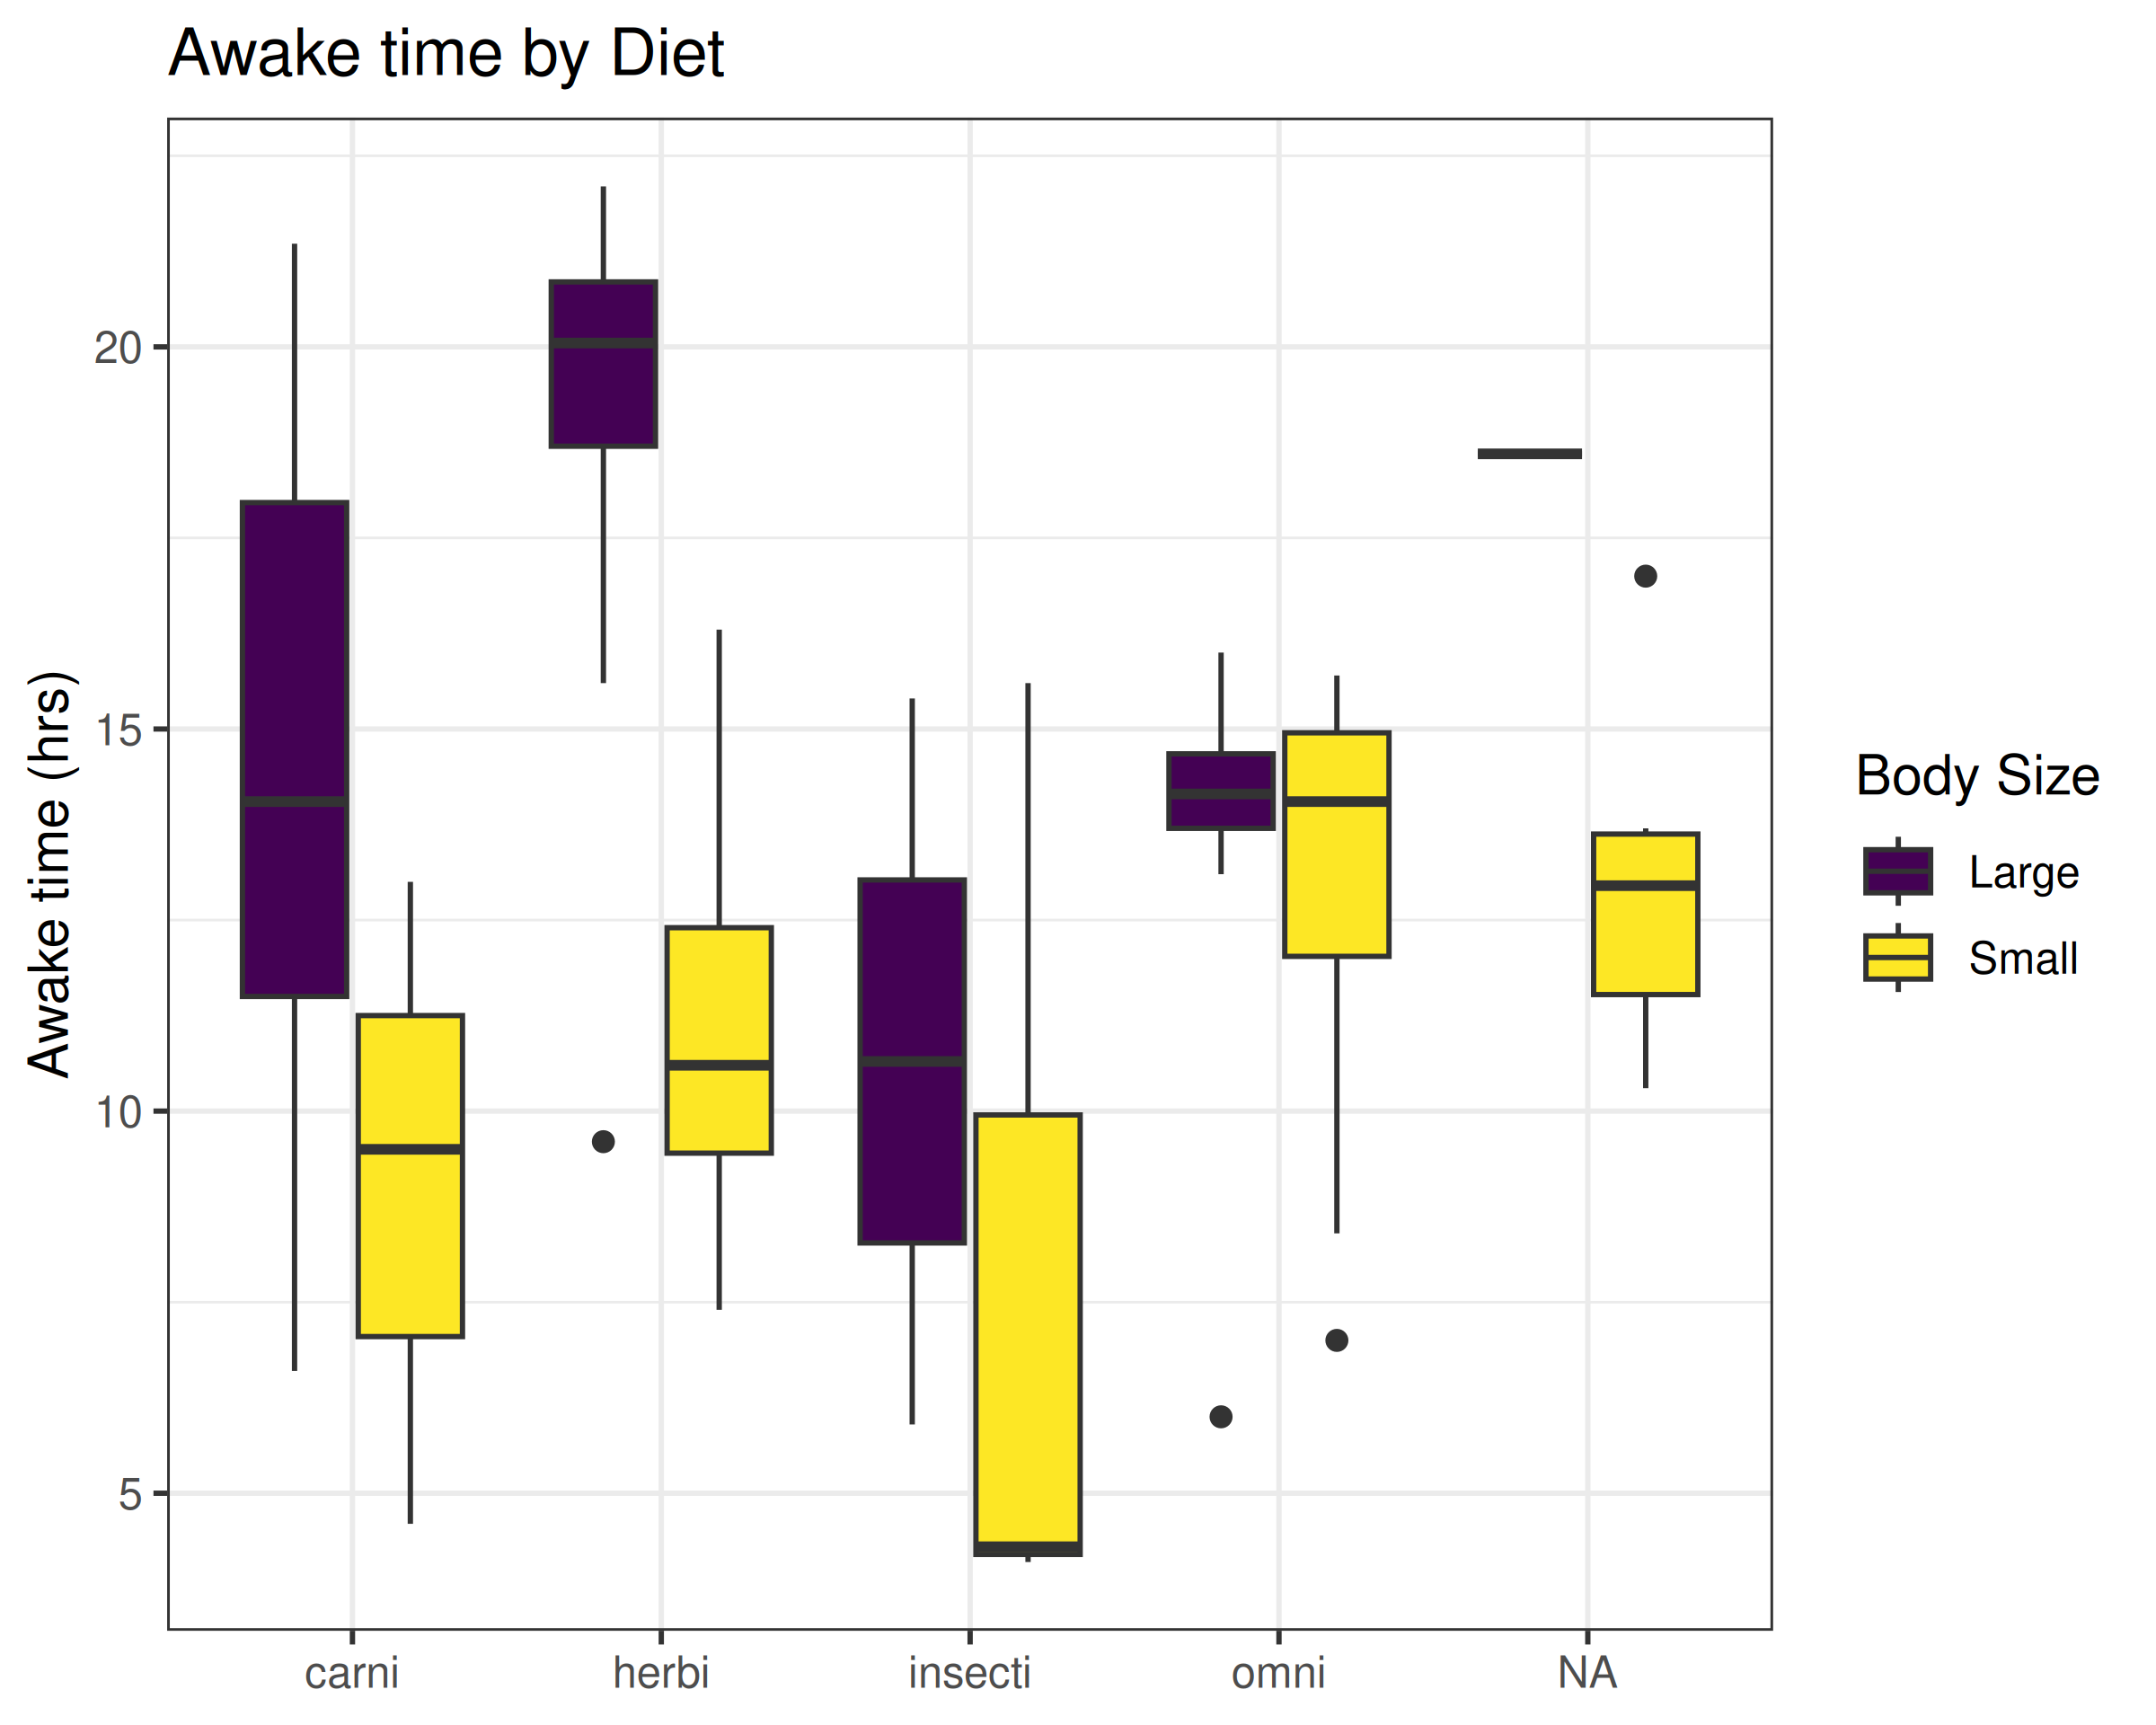
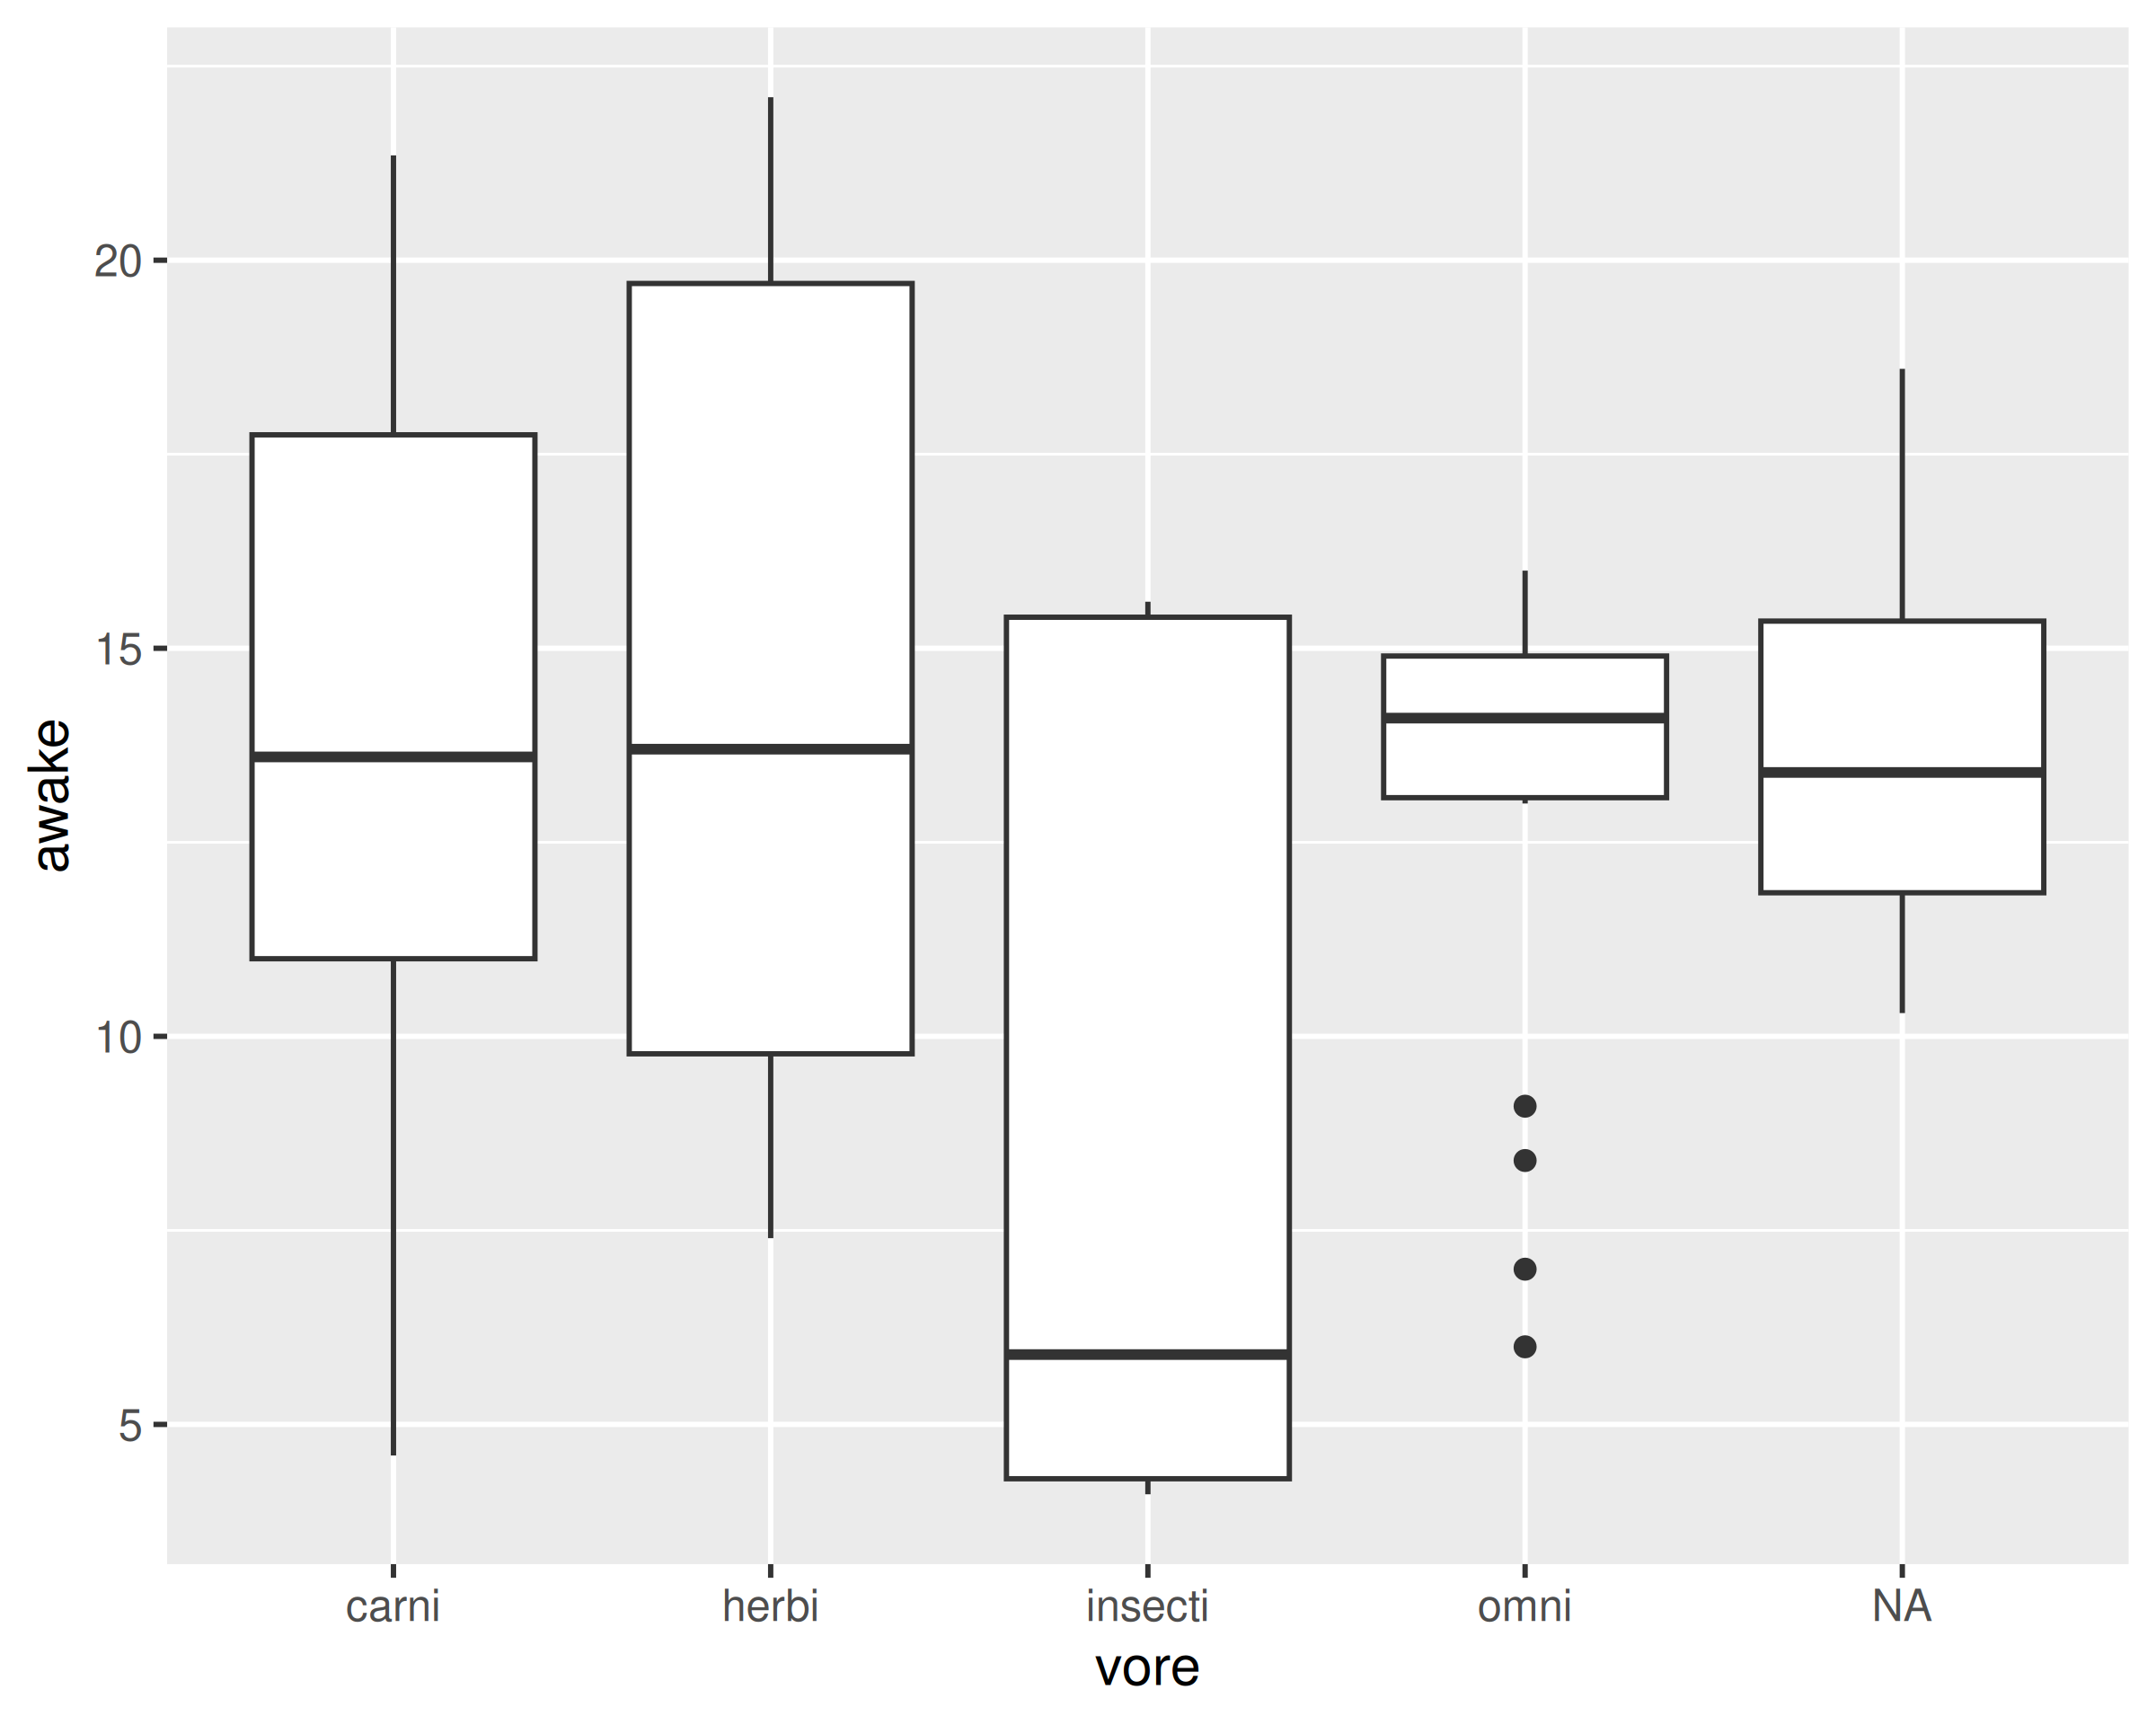
How do I change the order of vore?
Reproducible, but not minimal
library(ggplot2)

m <- msleep |>
  mutate(`Body Size` = if_else(bodywt > median(bodywt),
                               "Large", "Small"))

ggplot(m, aes(x = vore, y = awake, fill = `Body Size`)) +
  theme_bw() +
  theme(axis.title.x = element_blank()) +
  geom_boxplot() +
  scale_fill_viridis_d() +
  labs(y = "Awake time (hrs)",
       title = "Awake time by Diet")