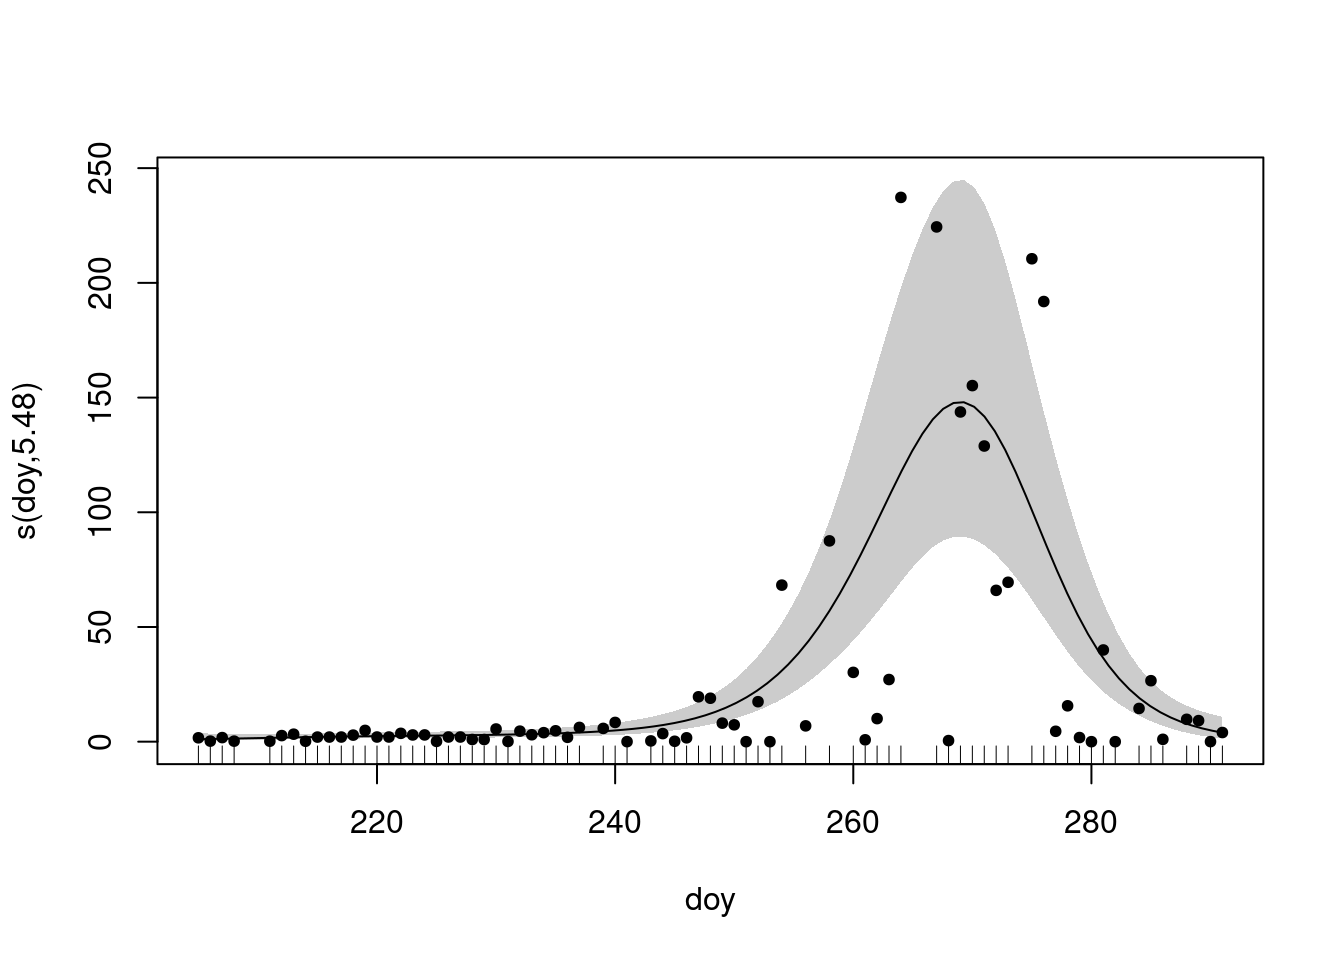
library(readr)library(mgcv)library(dplyr)v <-read_csv("Data/Datasets/vultures_clean_2023.csv")g <-gam(count ~s(doy, k =10), data =filter(v, year ==2000) |>mutate(l =3), method ="REML", family ="nb")summary(g)
Method: REML   Optimizer: outer newton
full convergence after 4 iterations.
Gradient range [8.674563e-10,1.084888e-07]
(score 271.1993 & scale 1).
Hessian positive definite, eigenvalue range [2.264941,28.62155].
Model rank =  10 / 10

Basis dimension (k) checking results. Low p-value (k-index<1) may
indicate that k is too low, especially if edf is close to k'.

         k'  edf k-index p-value
s(doy) 9.00 5.48    0.96    0.61
par(p0)
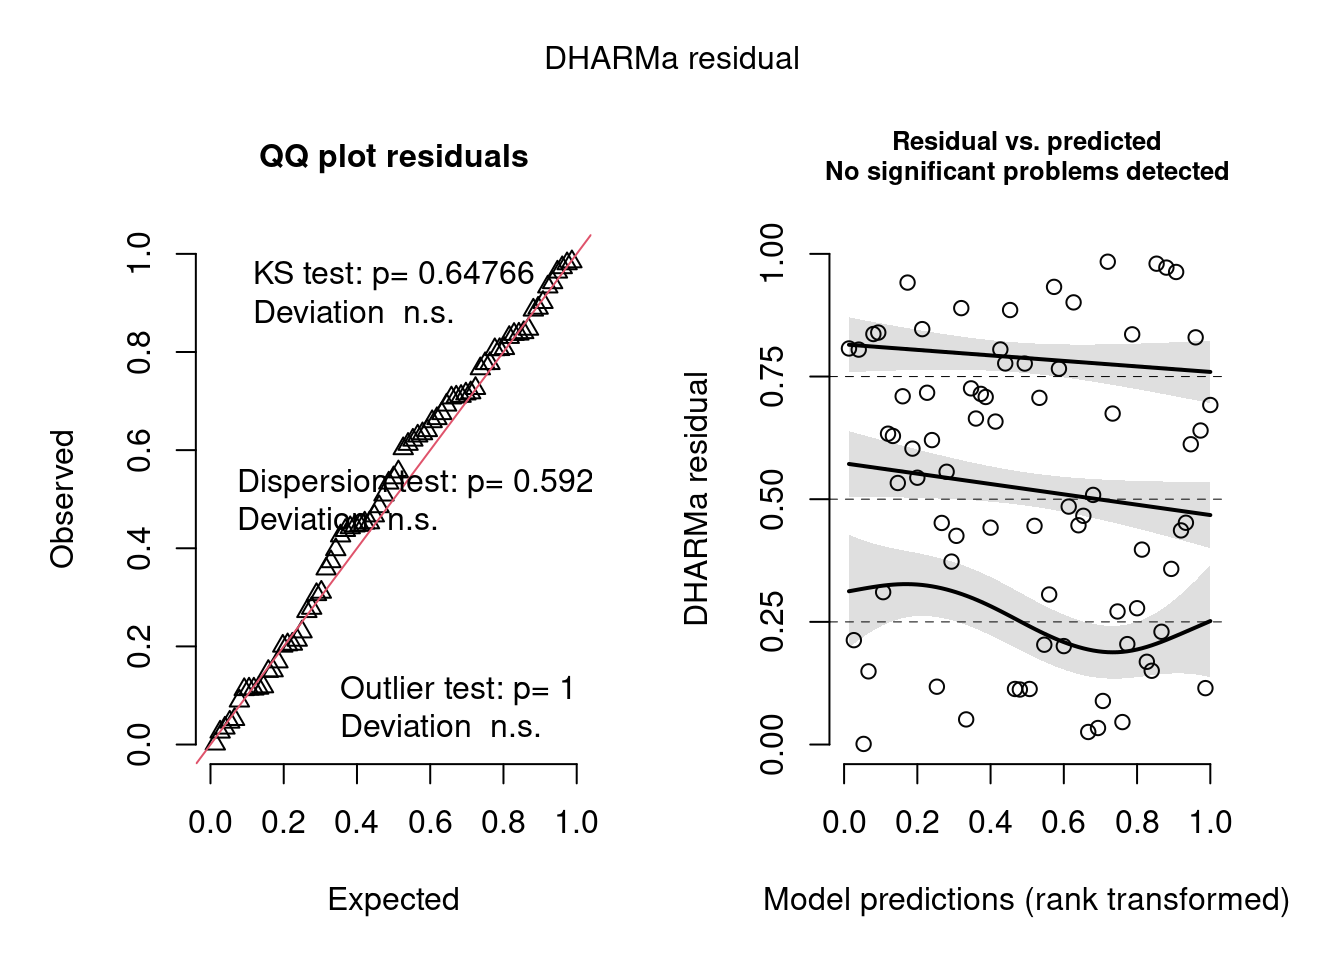
Compare to DHARMa
s <- DHARMa::simulateResiduals(g, plot =TRUE)
Registered S3 method overwritten by 'GGally':
  method from
  +.gg   ggplot2
Registered S3 method overwritten by 'mgcViz':
  method from
  +.gg   GGally